| SST | Sea surface temperature | Plot | Plot | Plot |
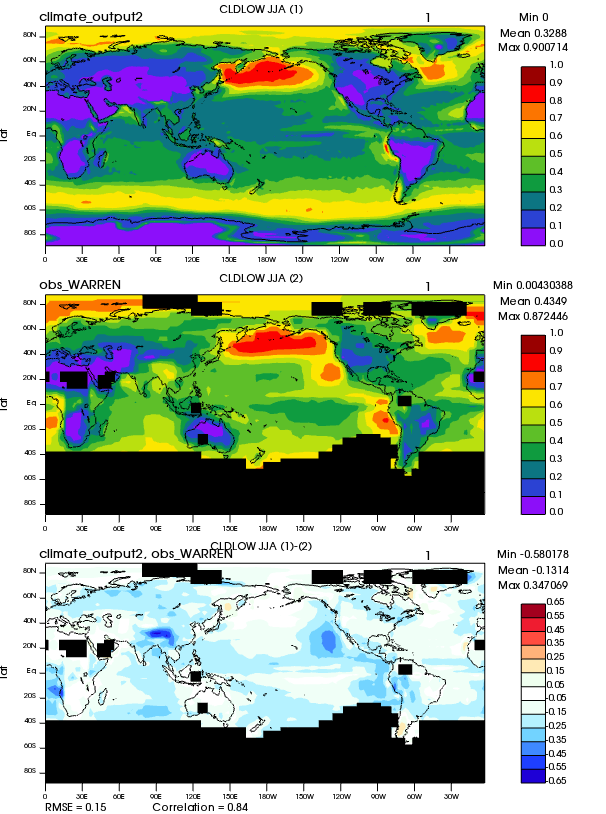
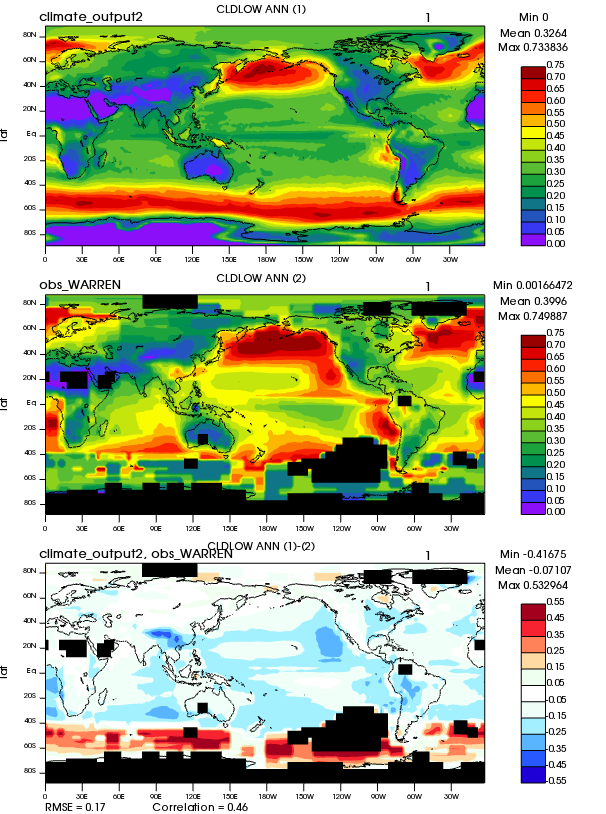
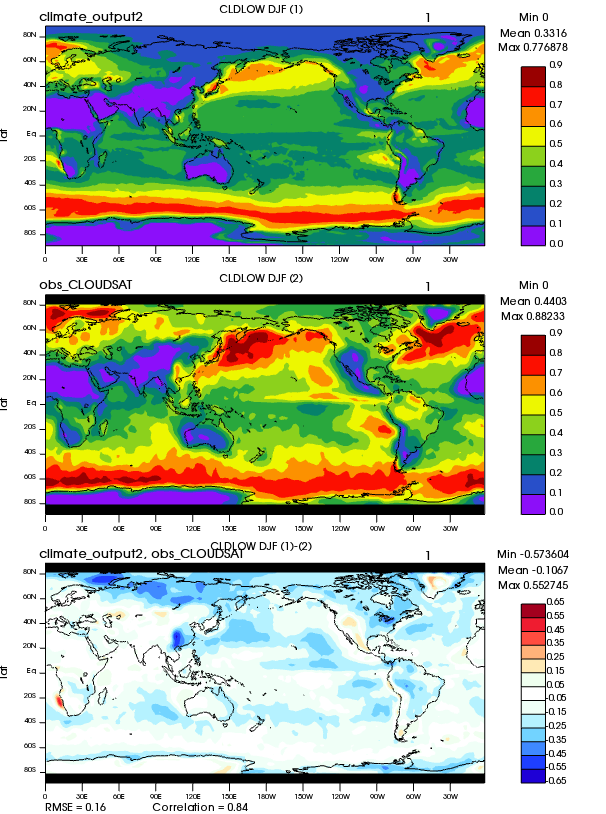
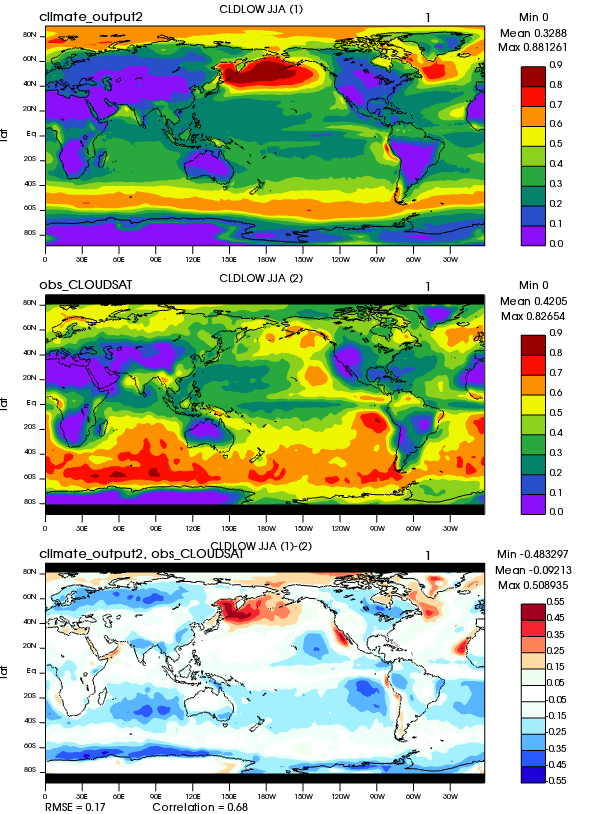
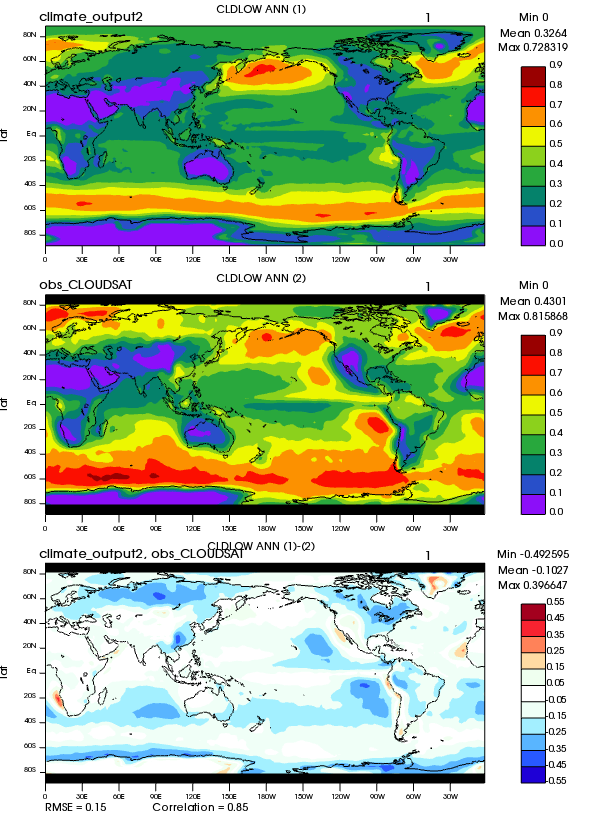
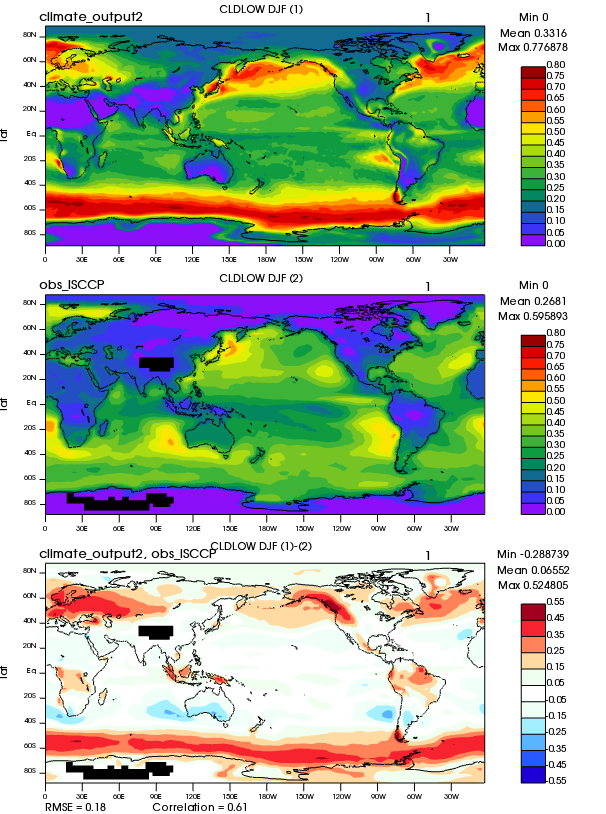
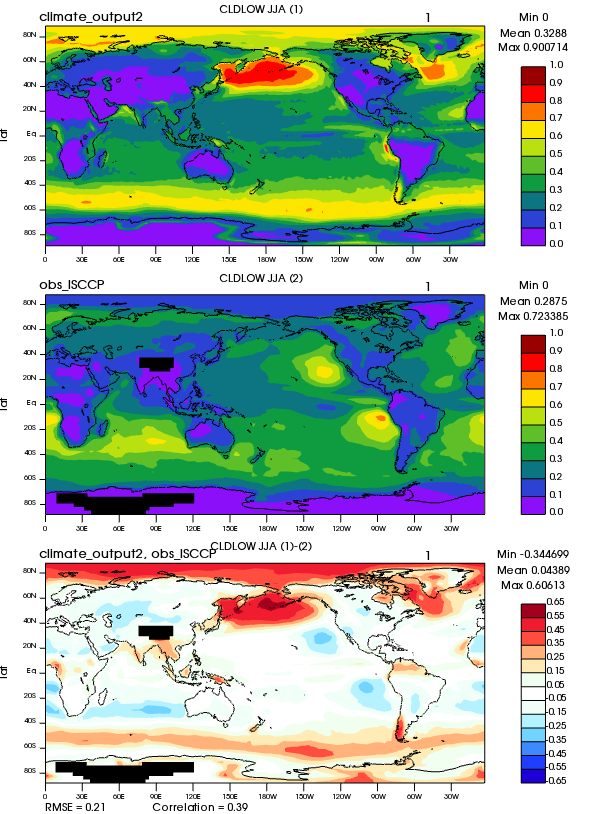
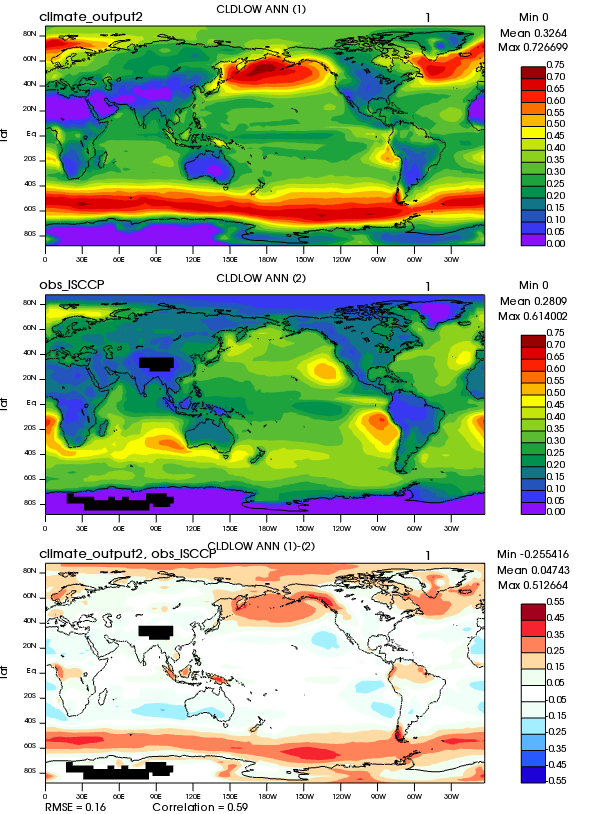
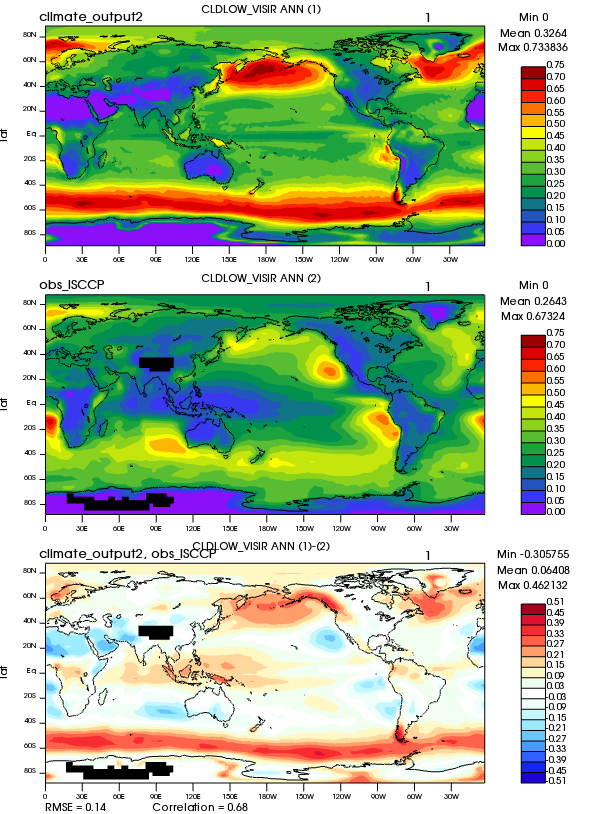
| CLDLOW | Low cloud amount (IR clouds) | Plot | Plot | Plot |
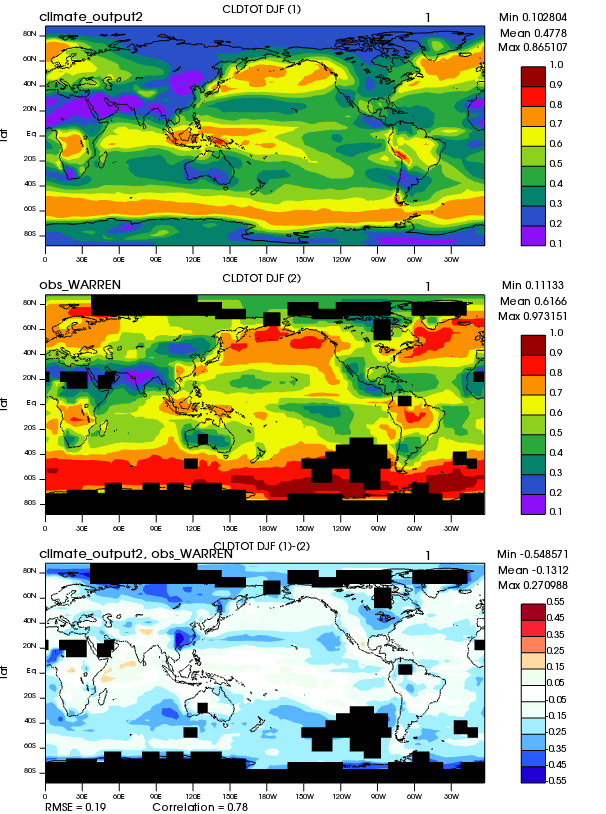
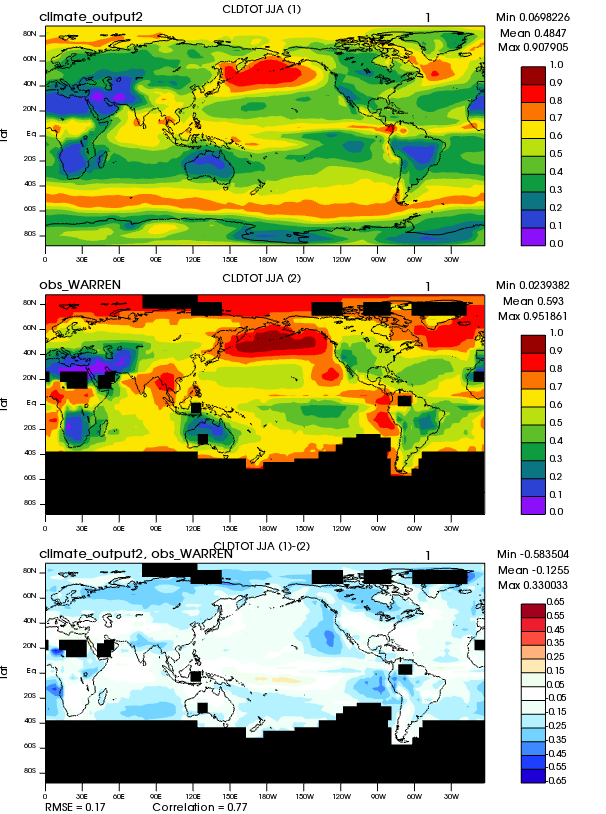
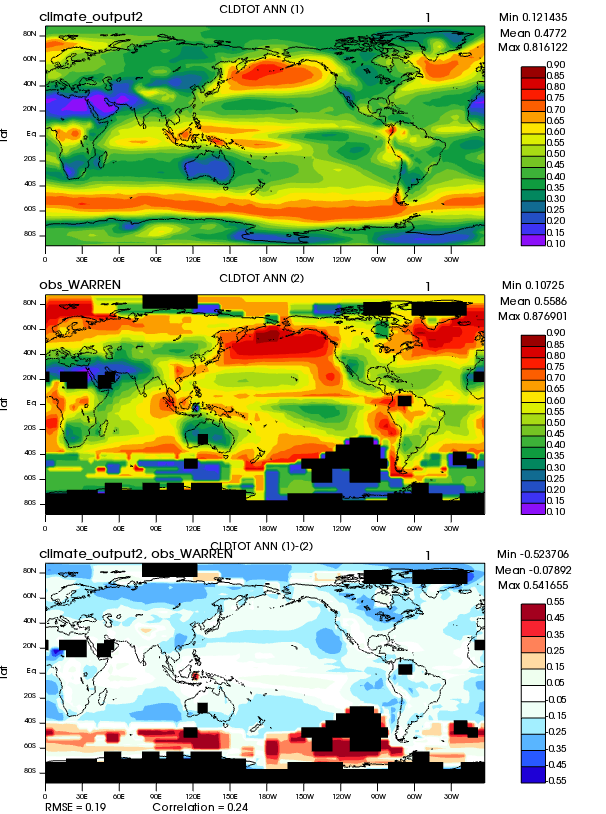
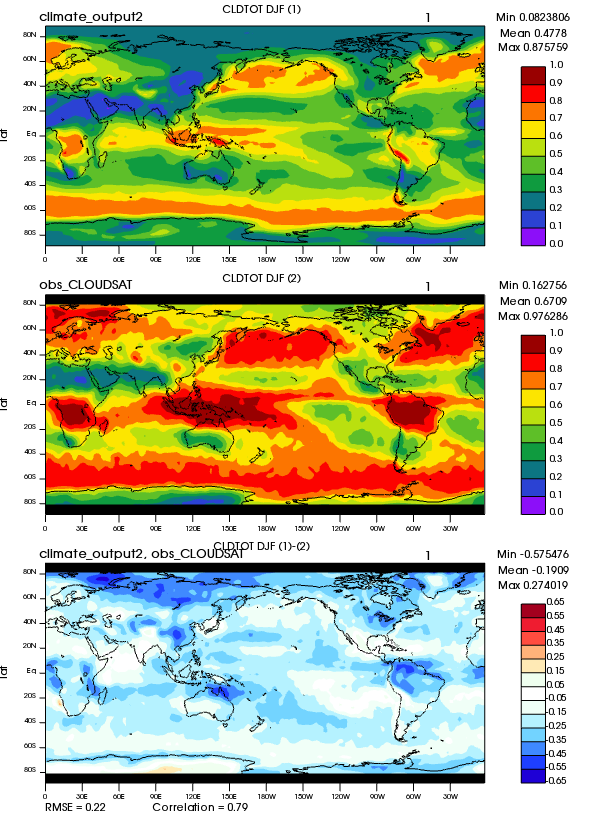
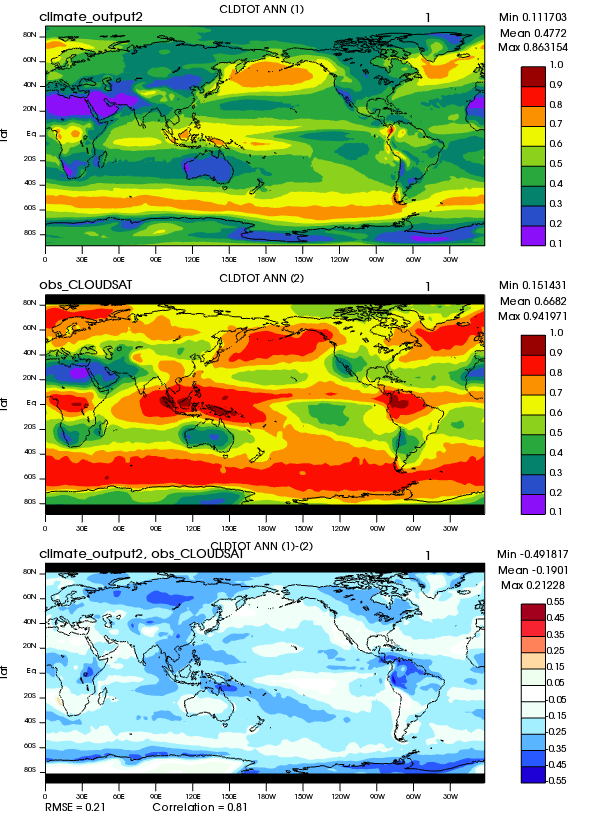
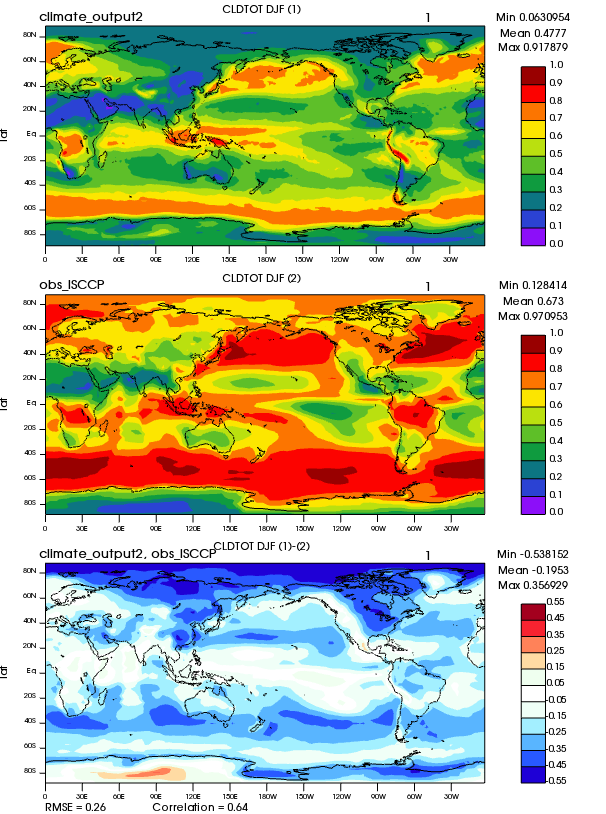
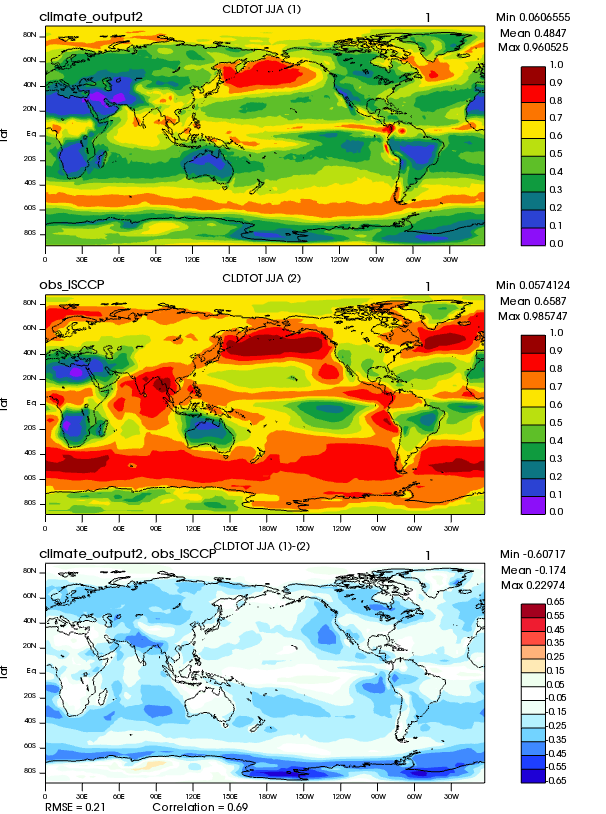
| CLDTOT | Mid cloud amount (IR clouds) | Plot | Plot | Plot |
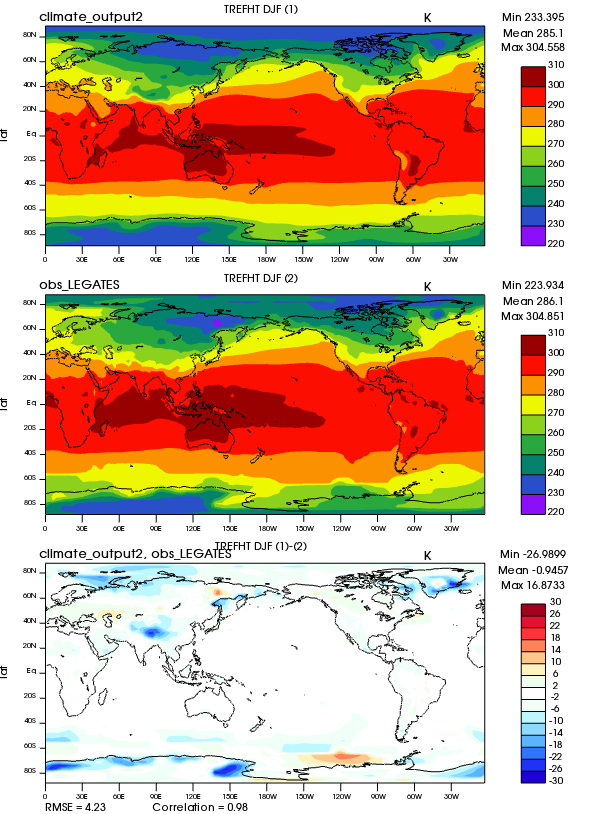
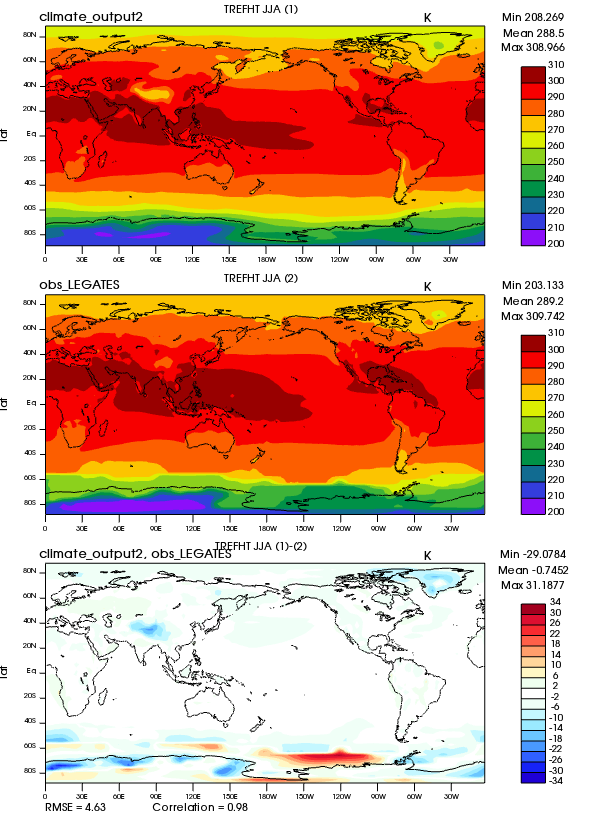
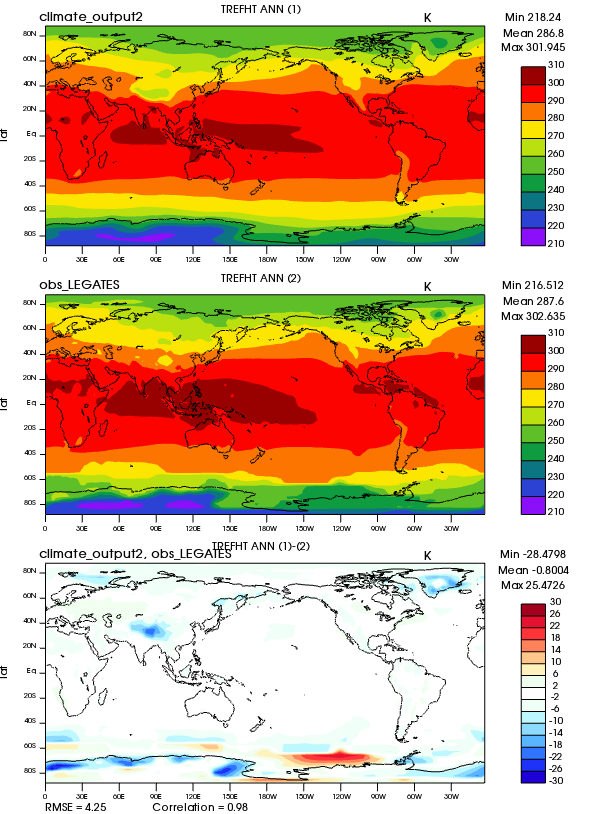
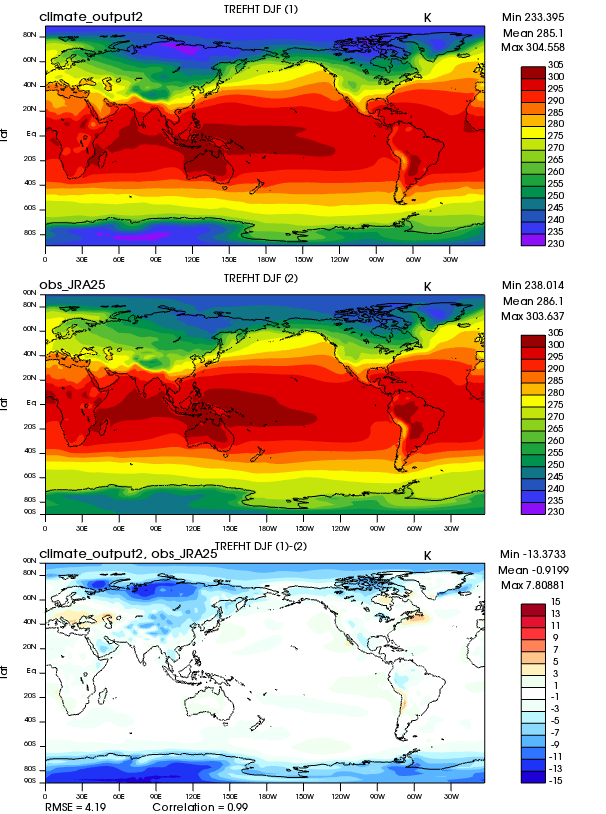
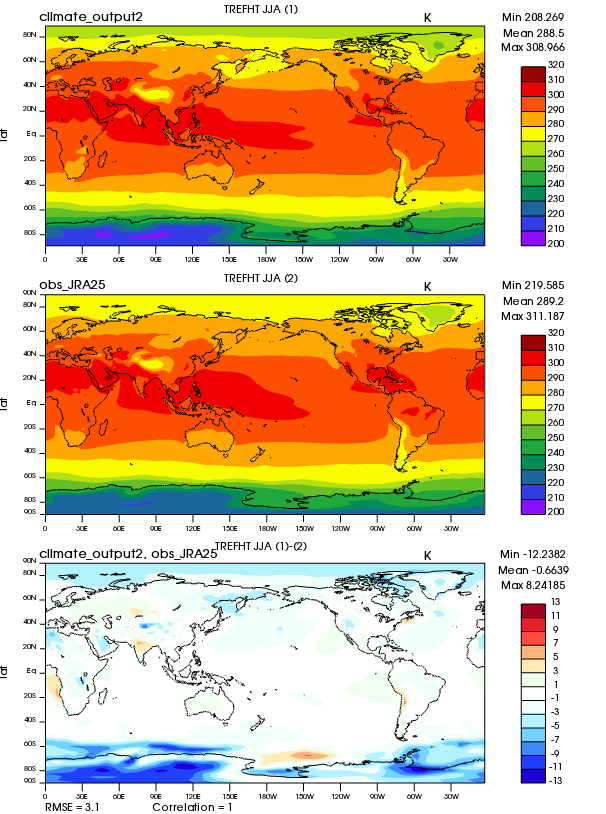
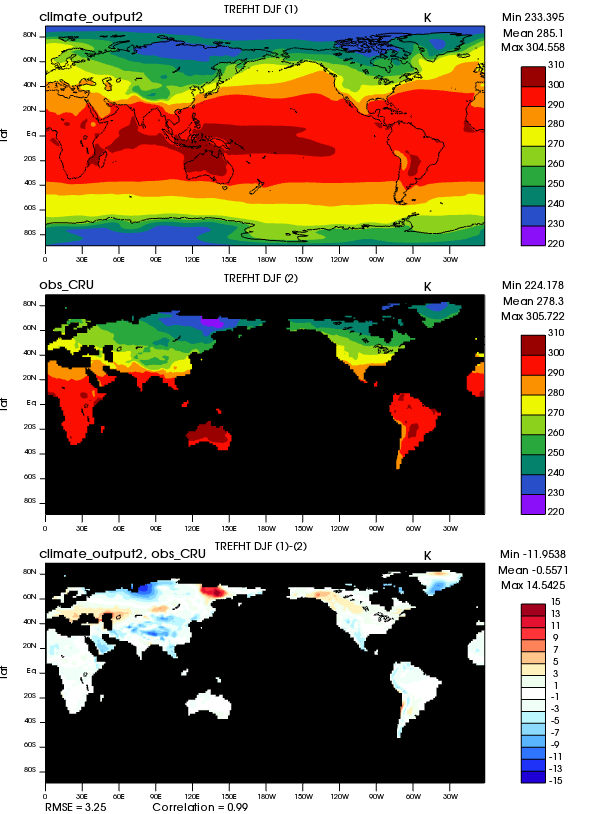
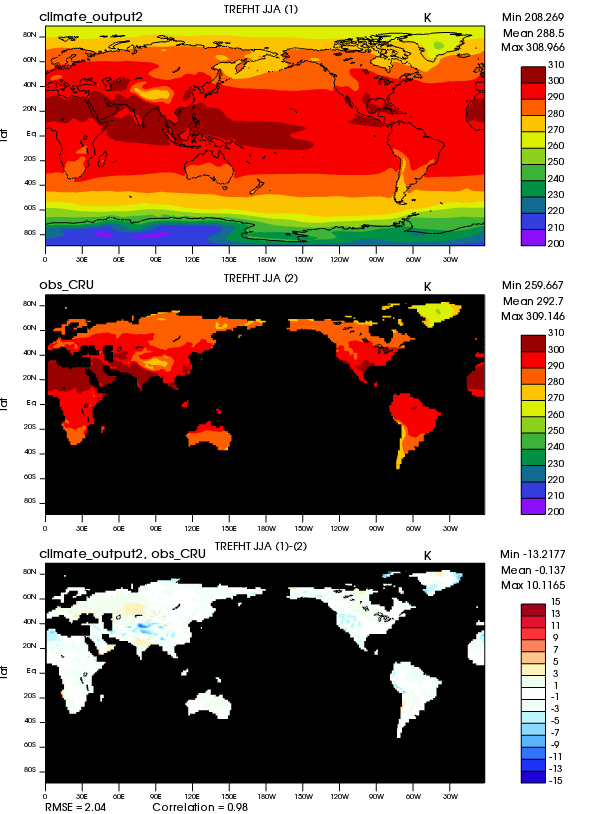
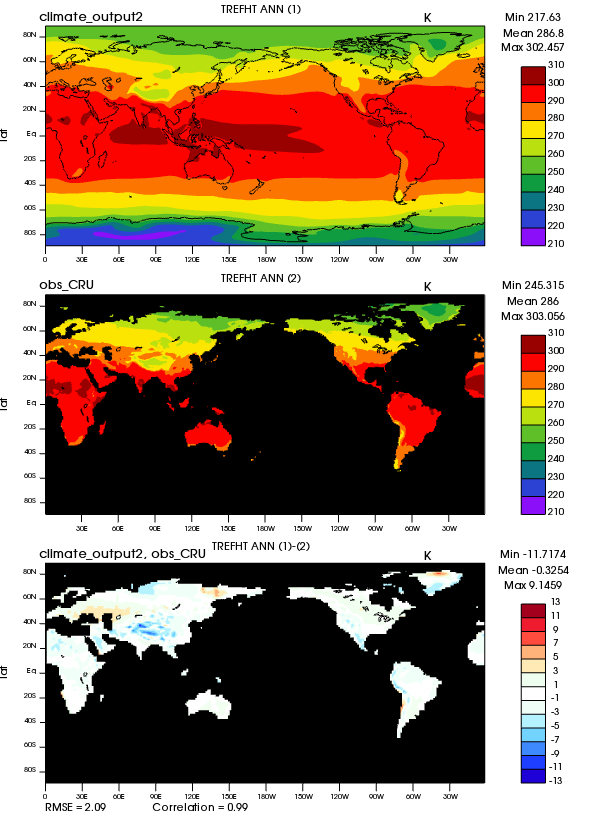
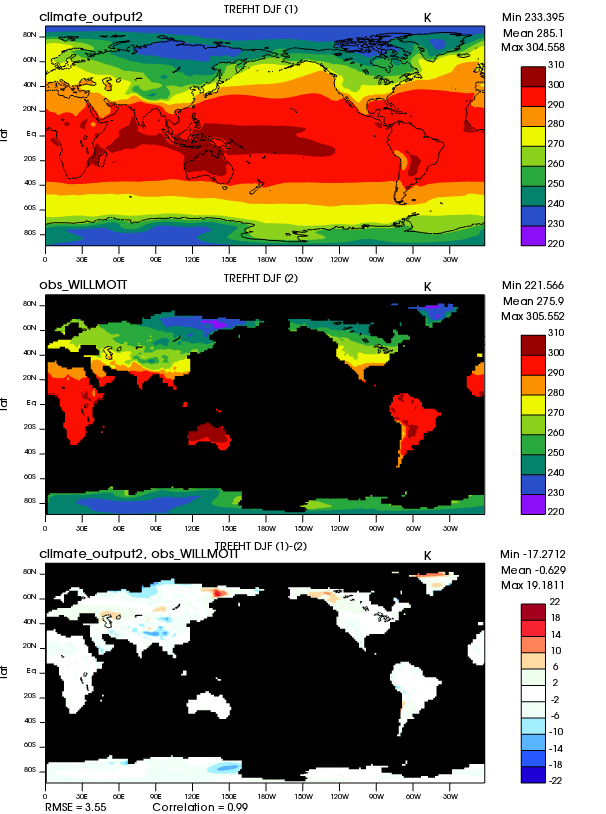
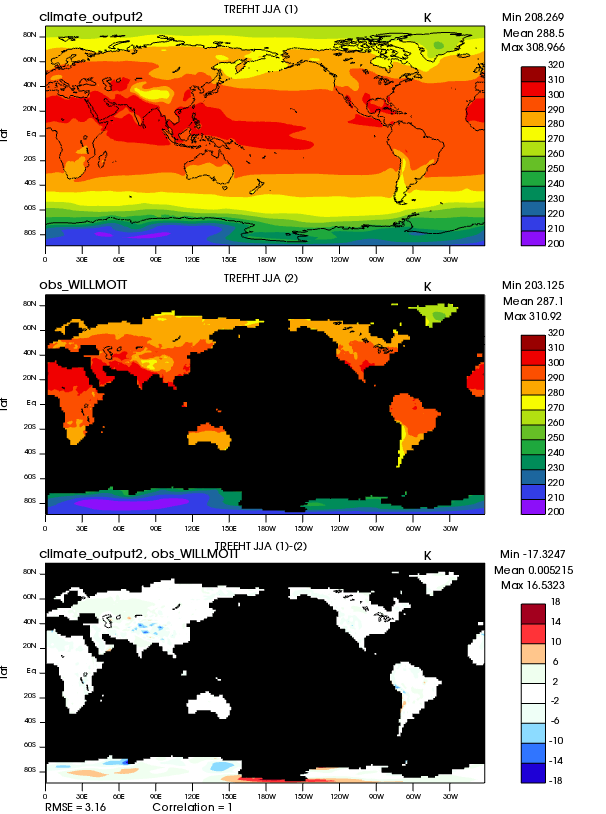
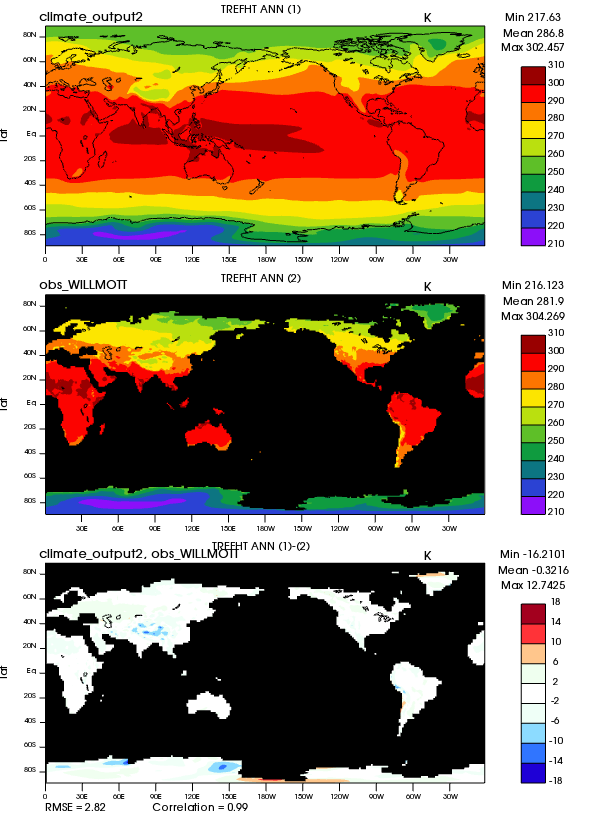
| TREFHT | 2-meter air temperature (land) | Plot | Plot | Plot |
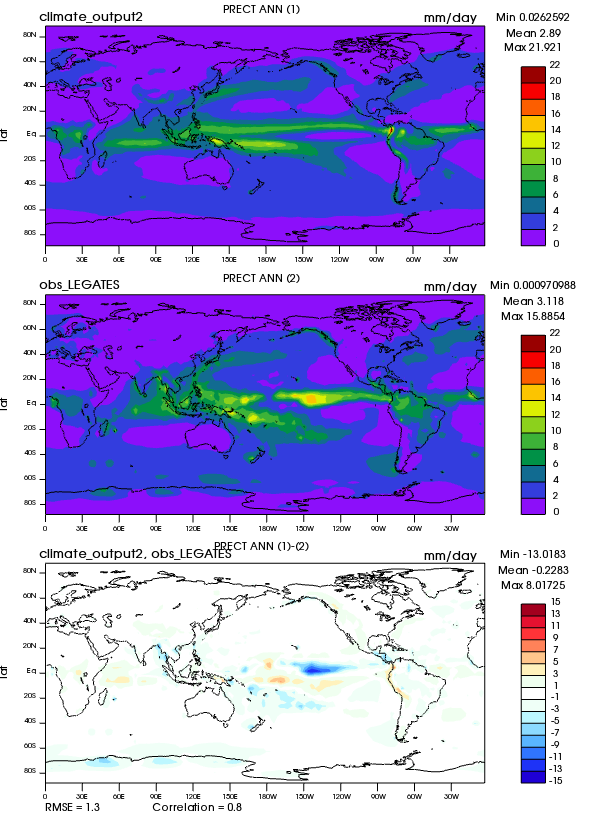
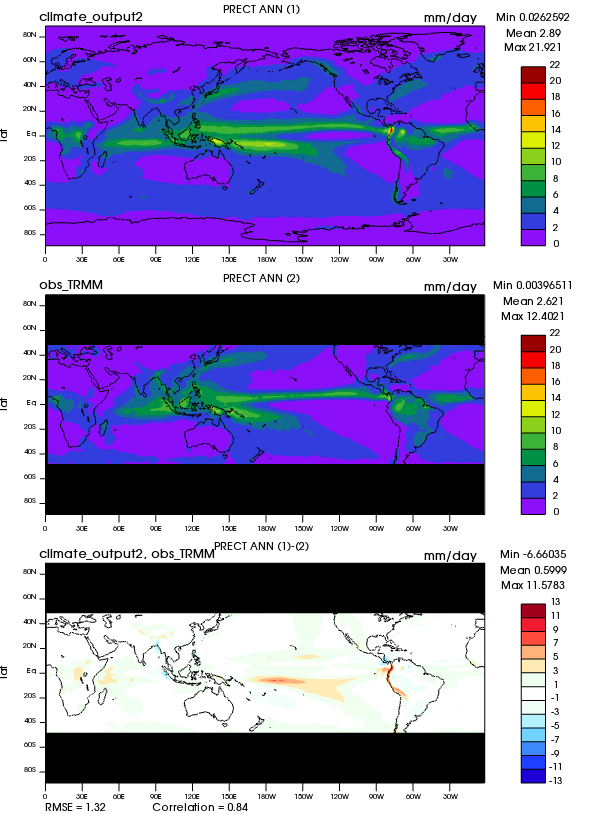
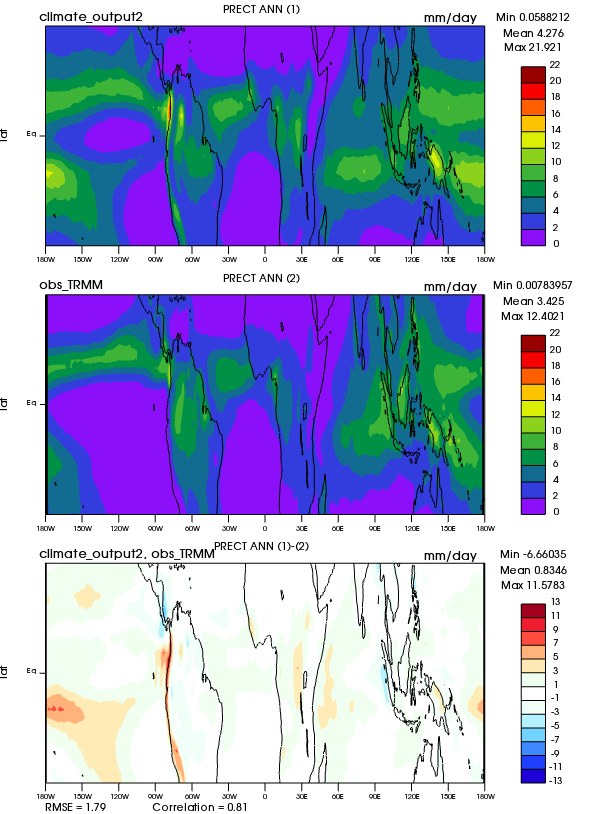
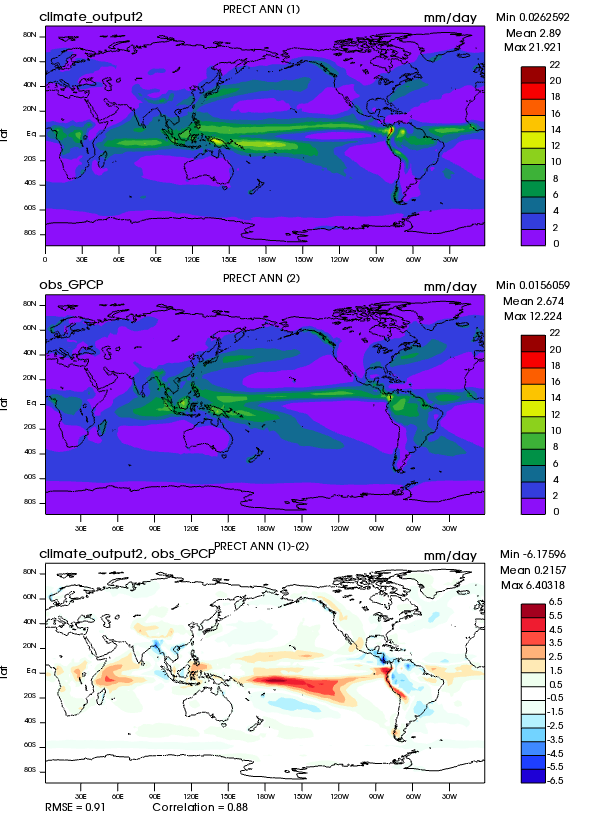
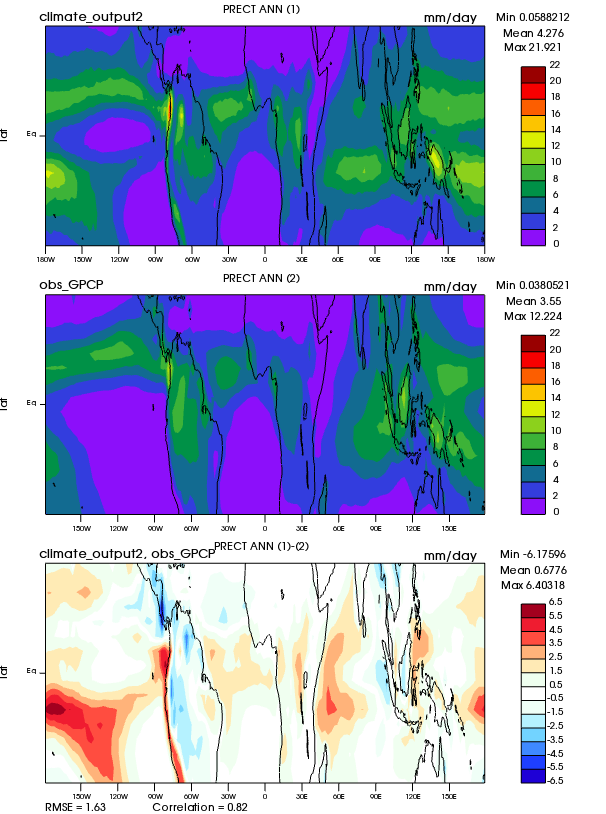
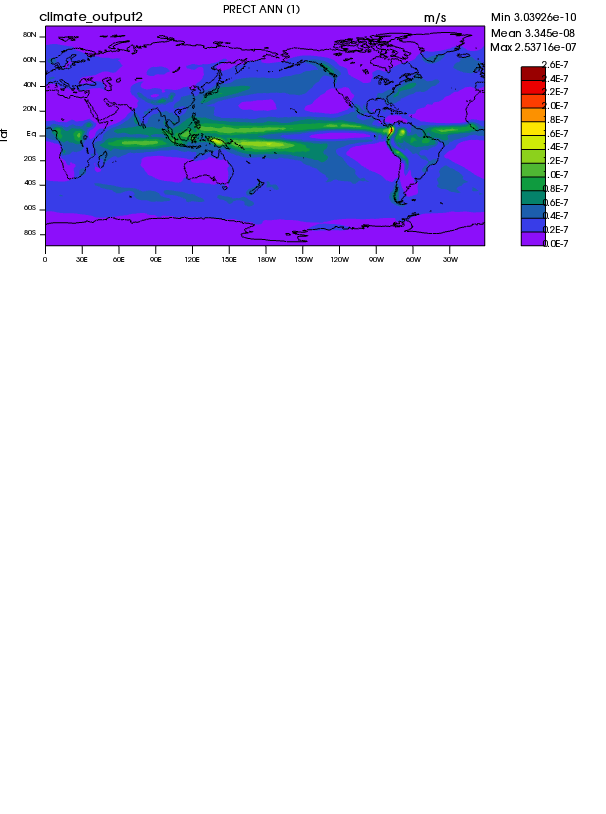
| PRECT | Precipitation rate | Plot | Plot | Plot |
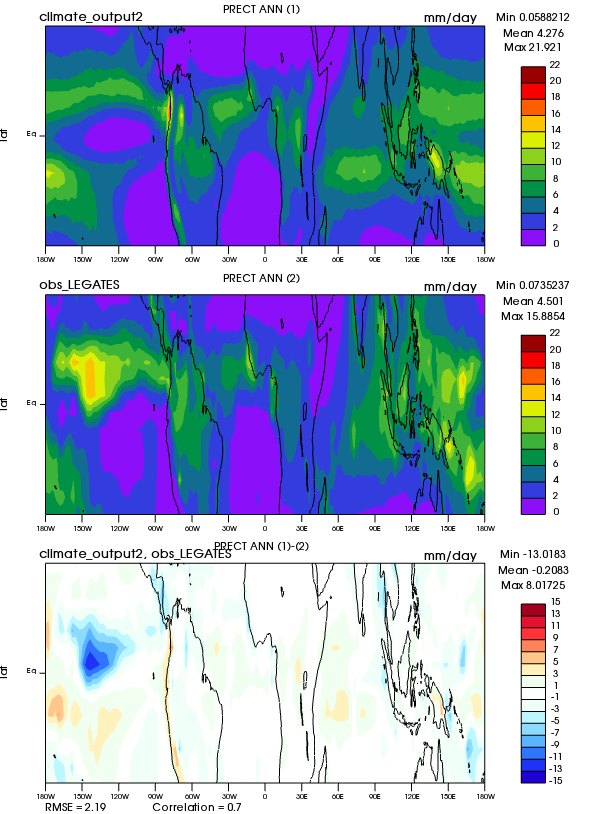
| PRECT | Precipitation rate | Plot | Plot | Plot |
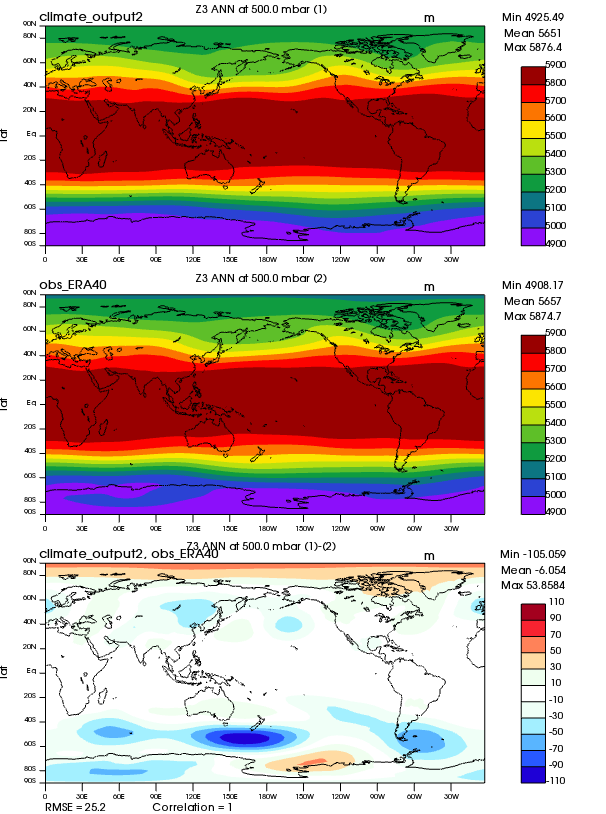
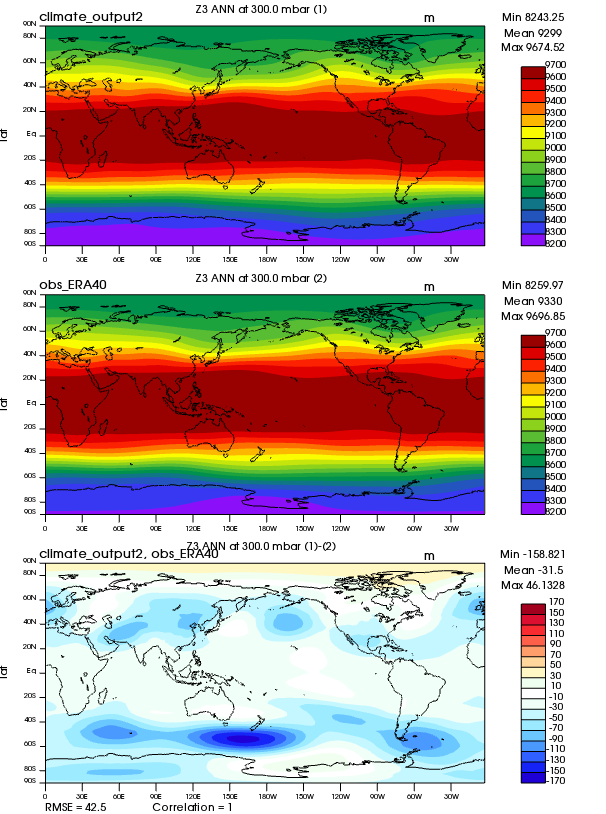
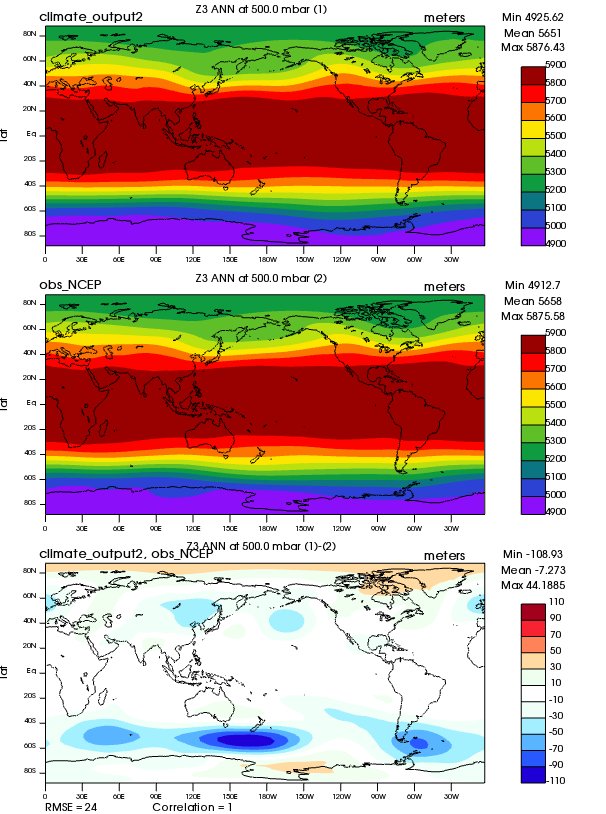
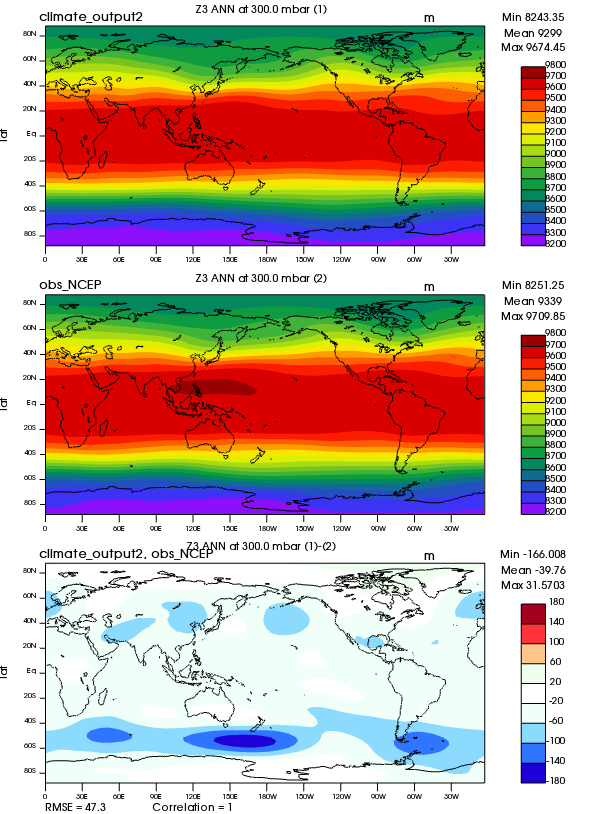
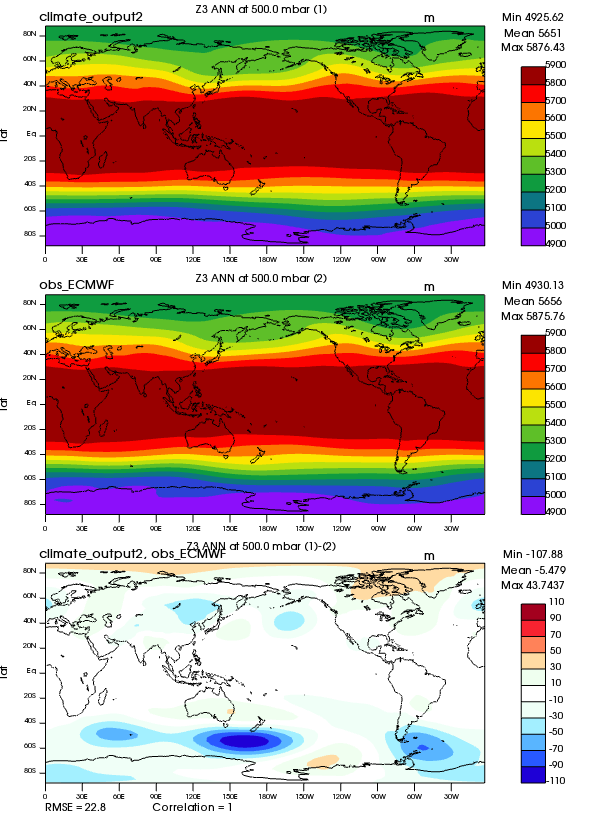
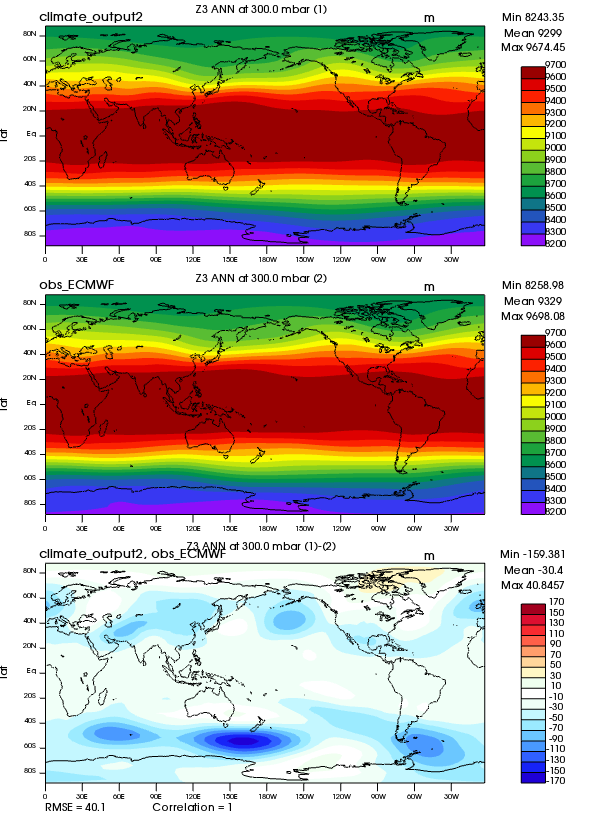
| Z3 | Geopotential height (Northern) | Plot | Plot | Plot |
| Z3 | Geopotential height (Northern) | Plot | Plot | Plot |
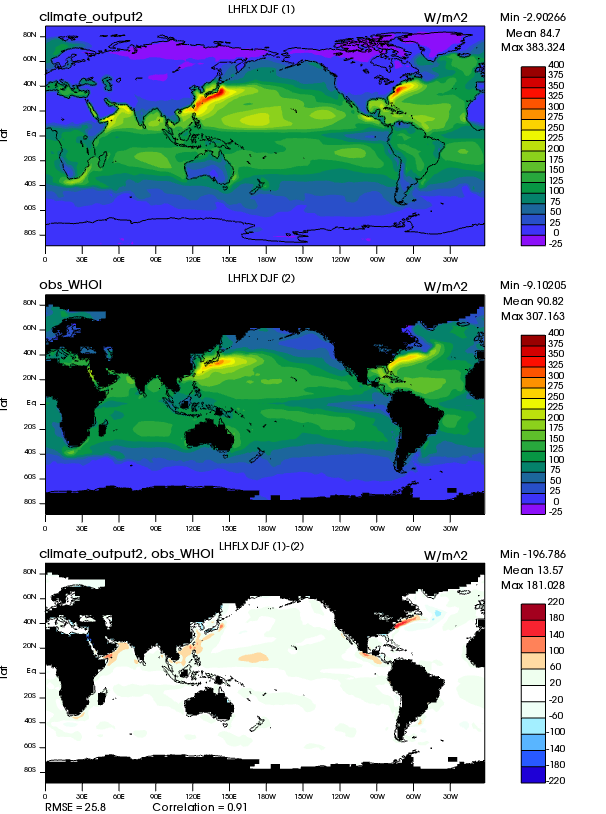
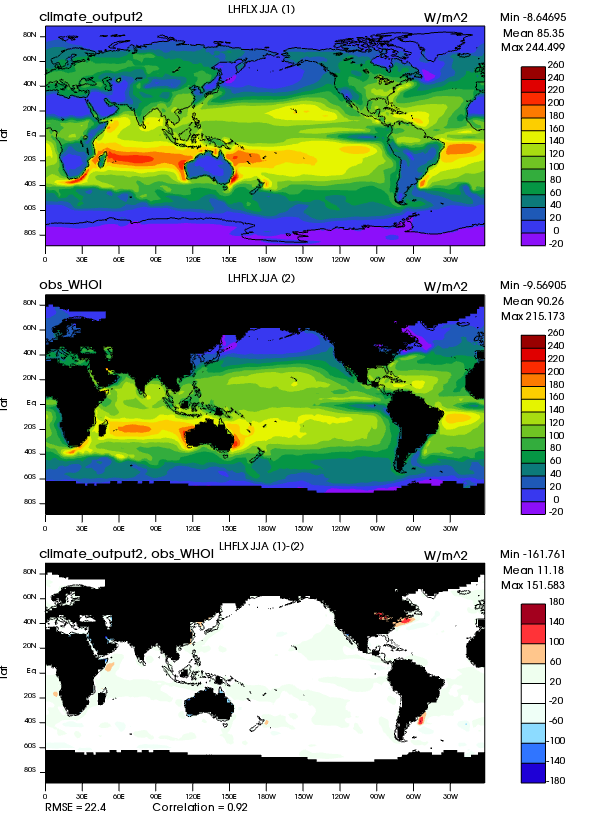
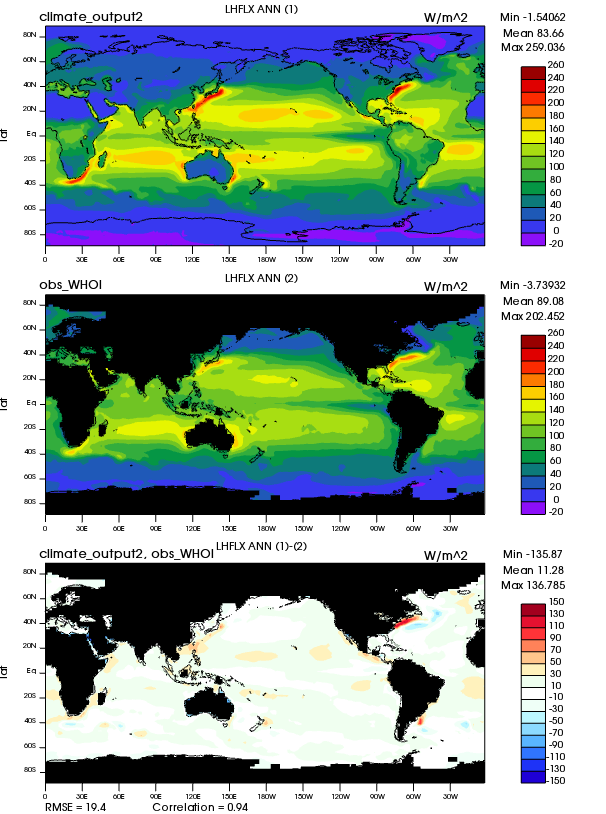
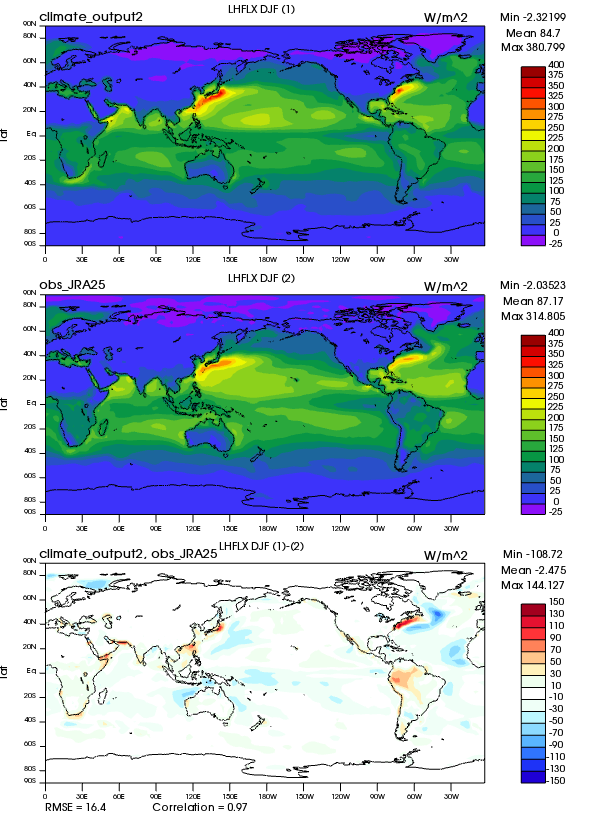
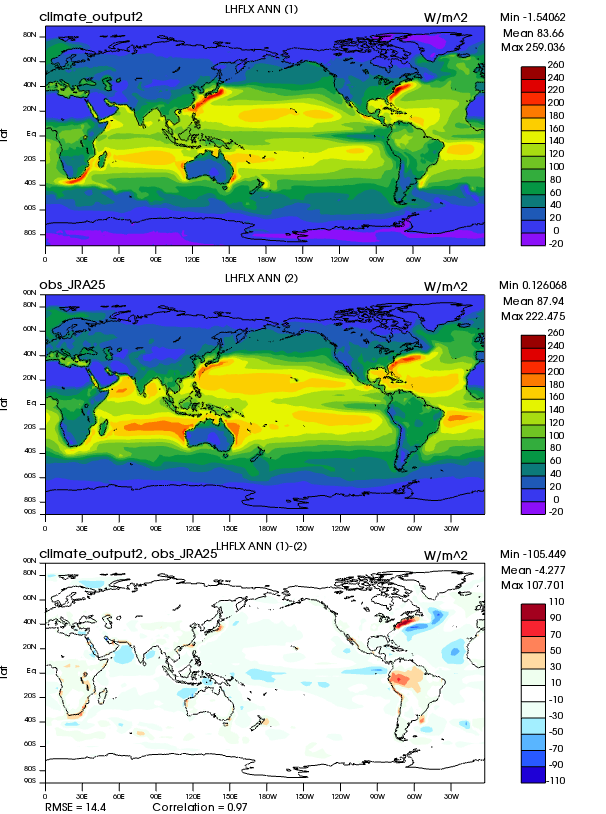
| LHFLX | Surface latent heat flux | Plot | Plot | Plot |
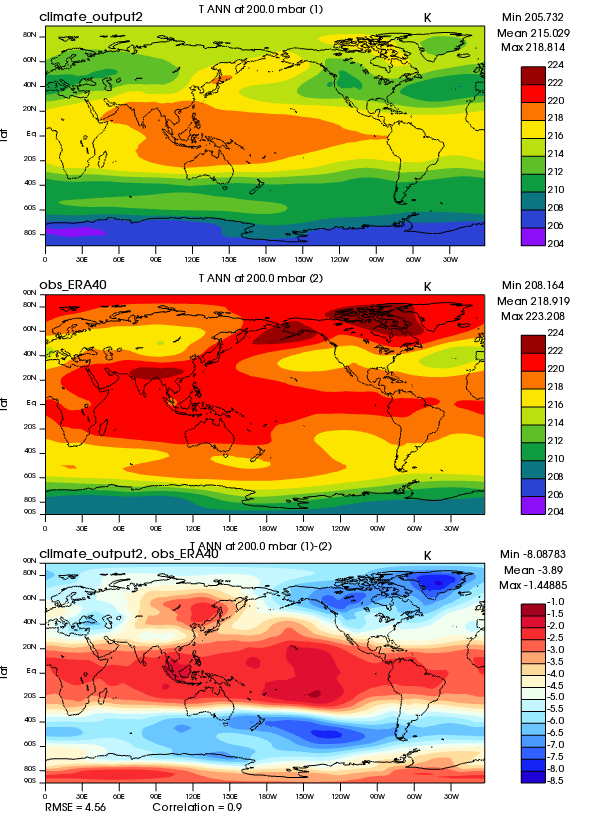
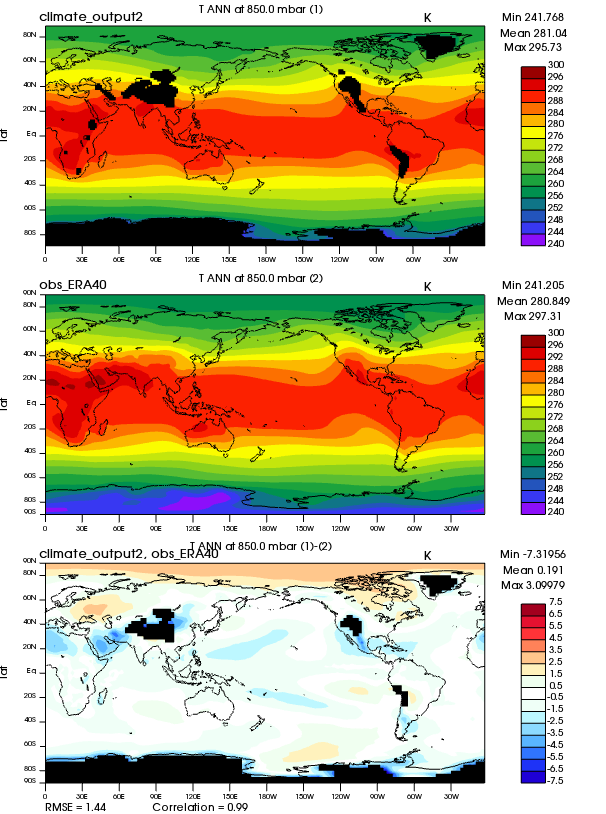
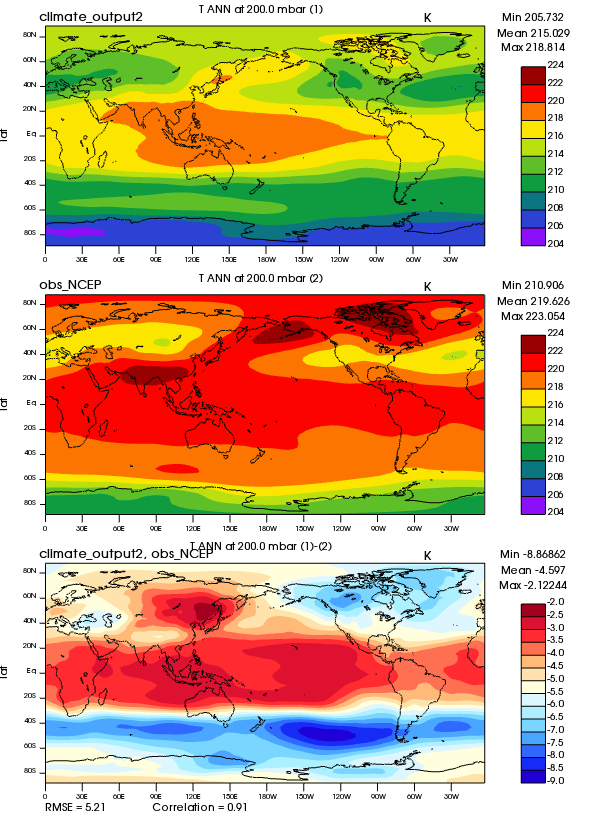
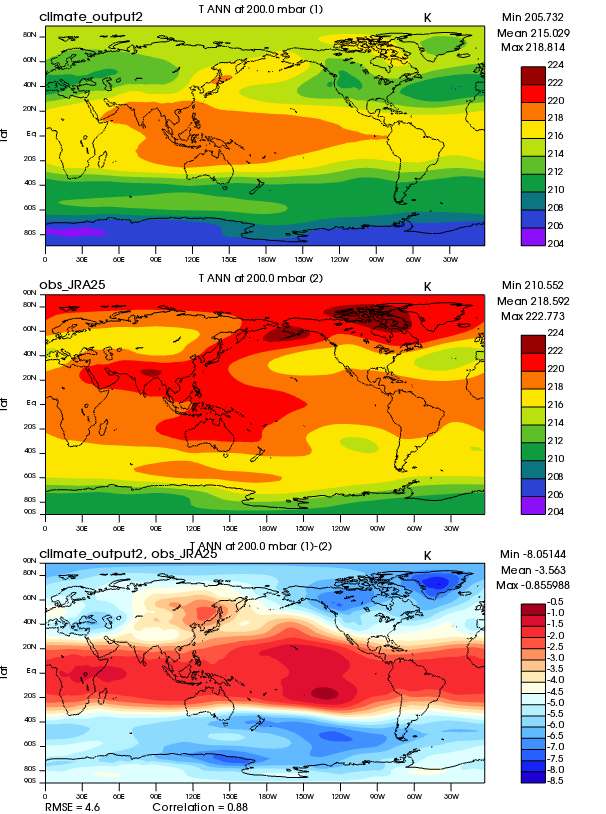
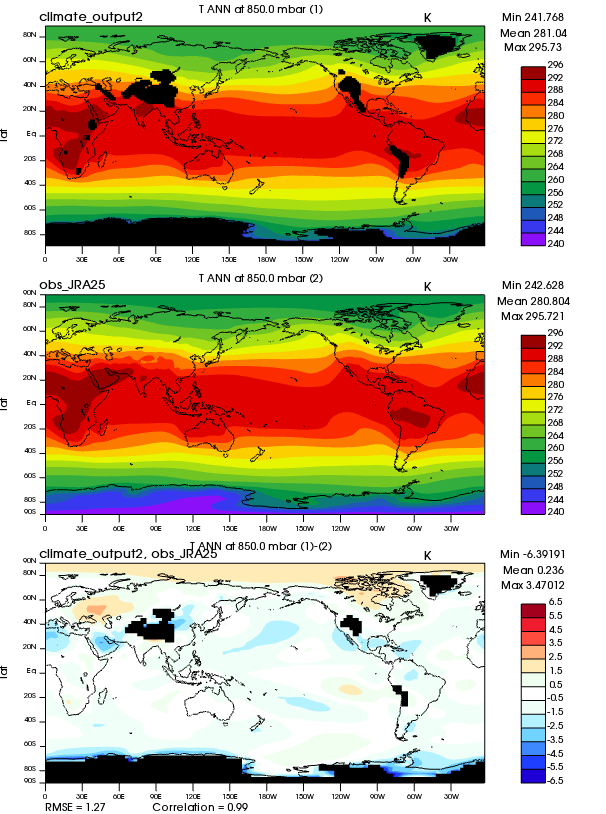
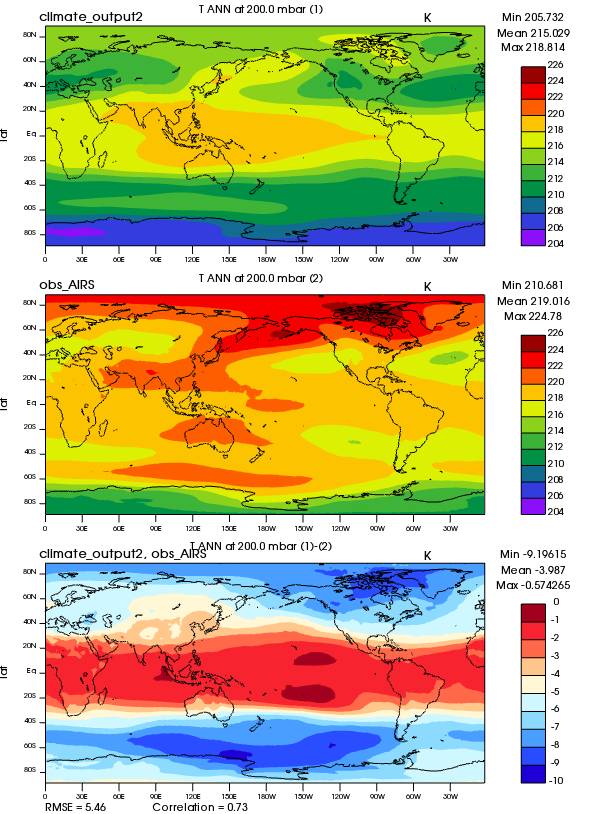
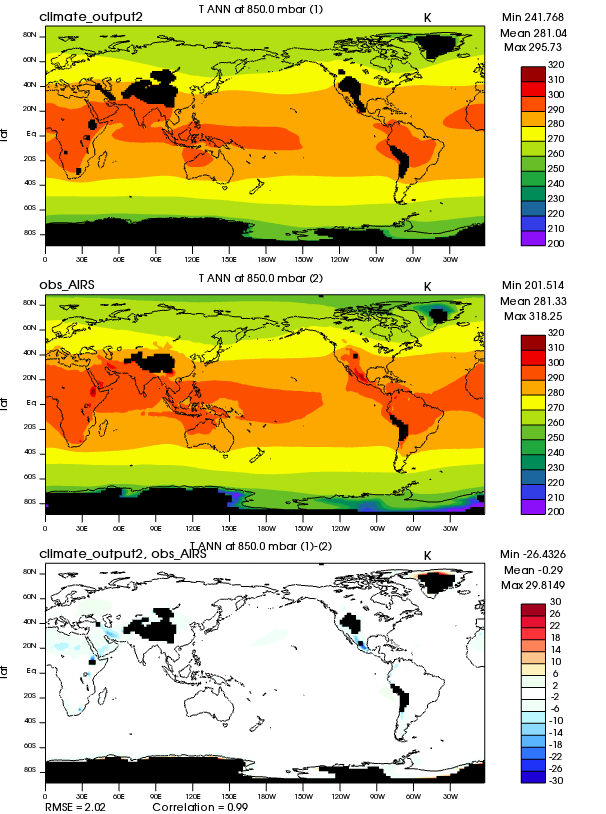
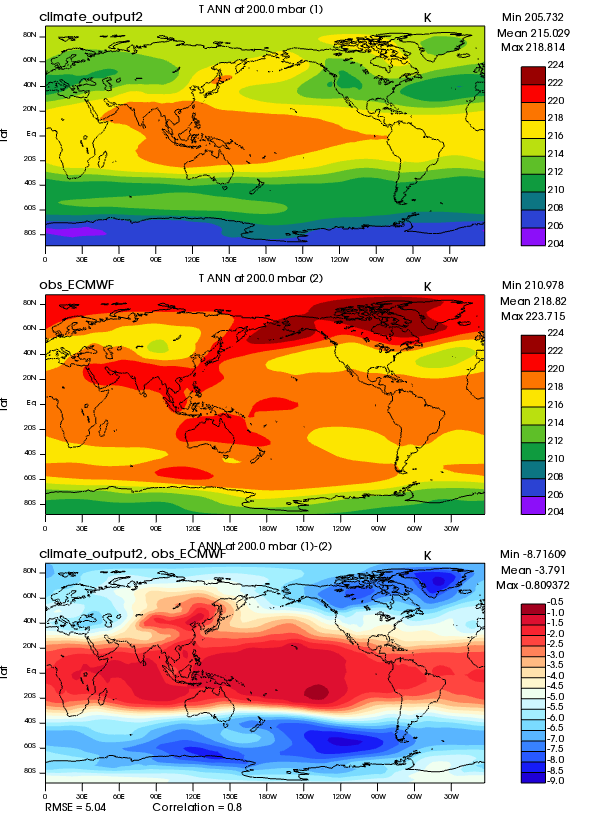
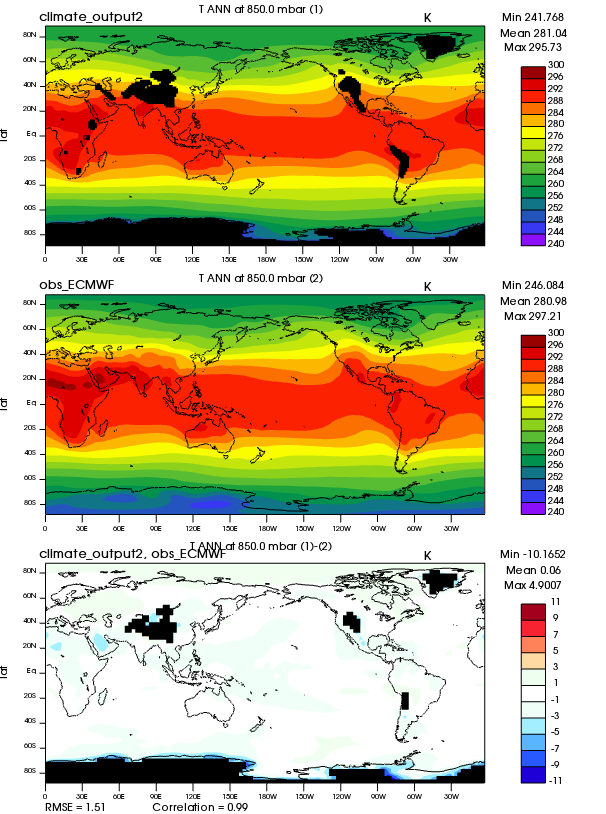
| T | Temperature | Plot | Plot | Plot |
| T | Temperature | Plot | Plot | Plot |
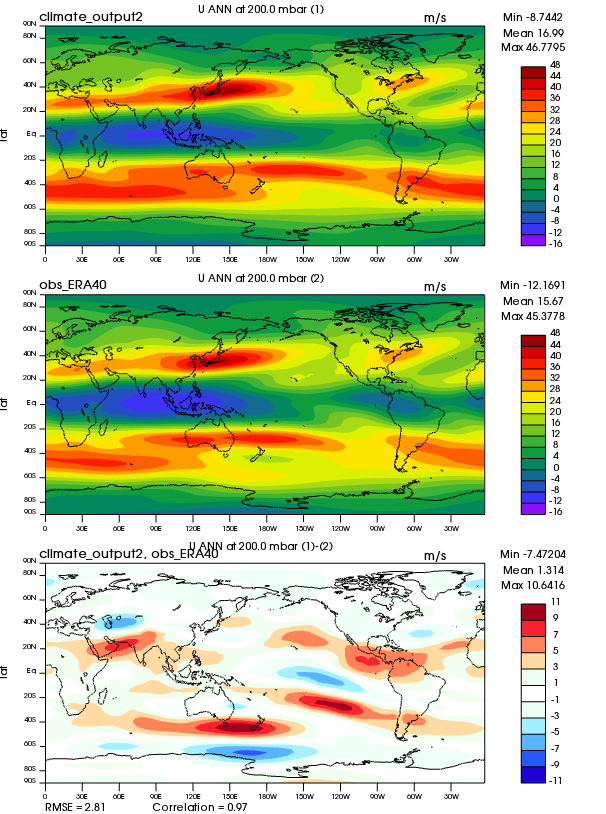
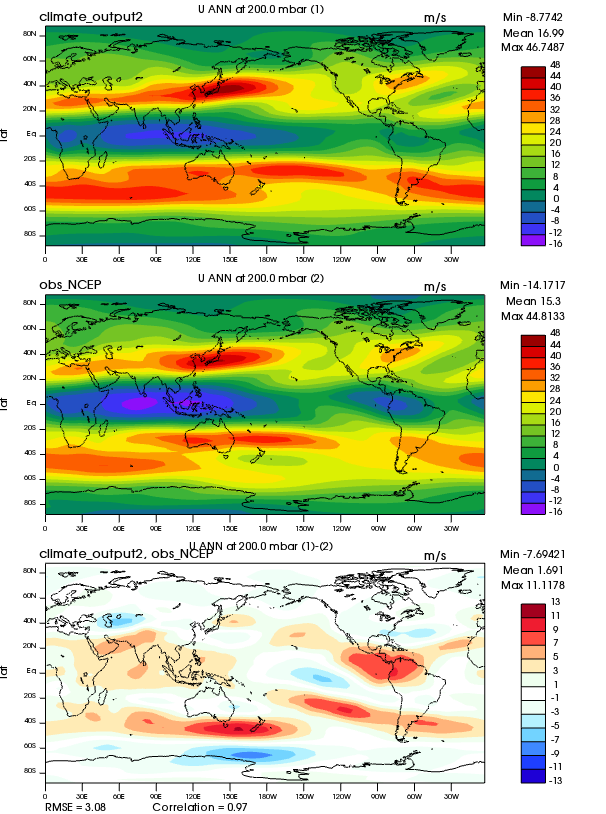
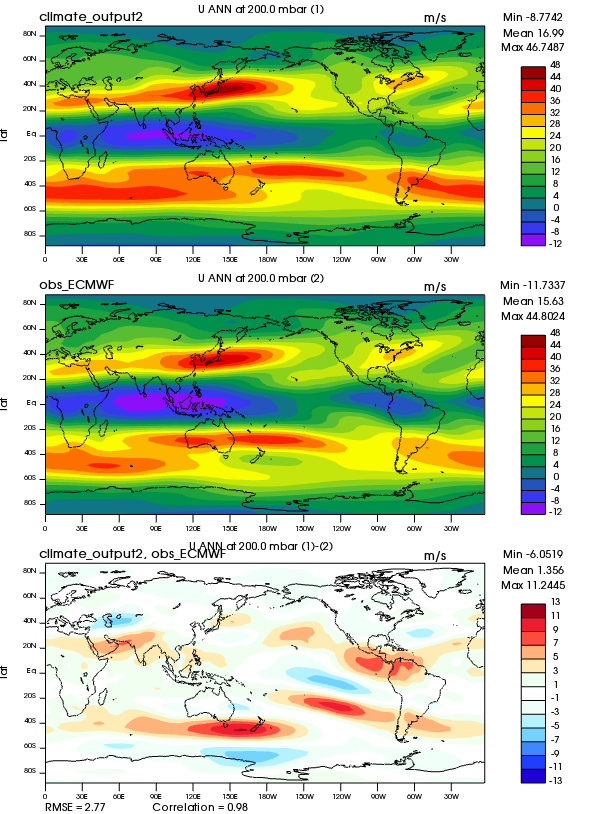
| U | Zonal Wind | Plot | Plot | Plot |
| PREH2O | Total precipitable water | Plot | Plot | Plot |
| PREH2O | Total precipitable water | Plot | Plot | Plot |
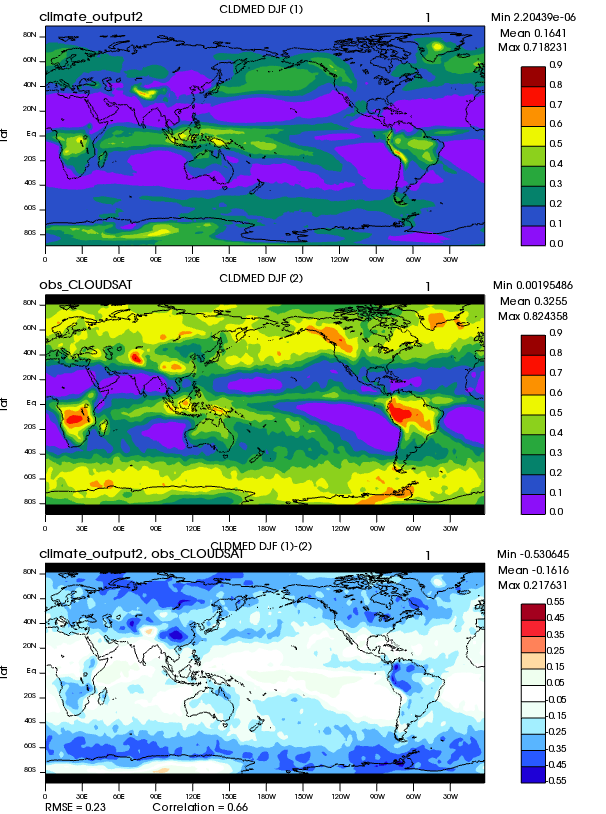
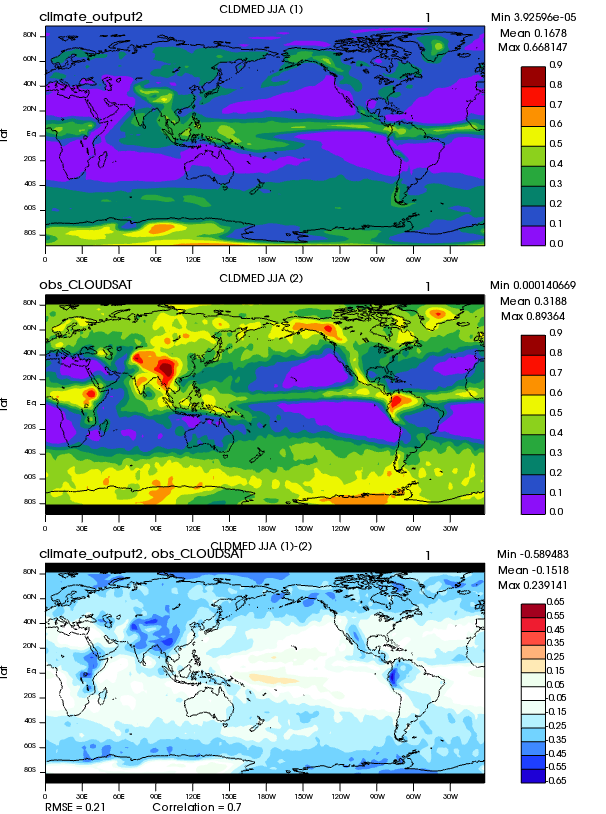
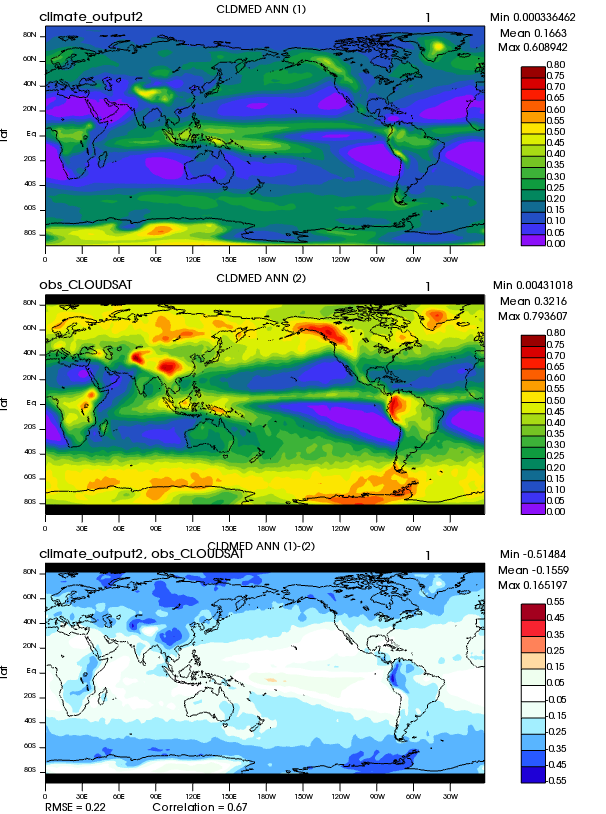
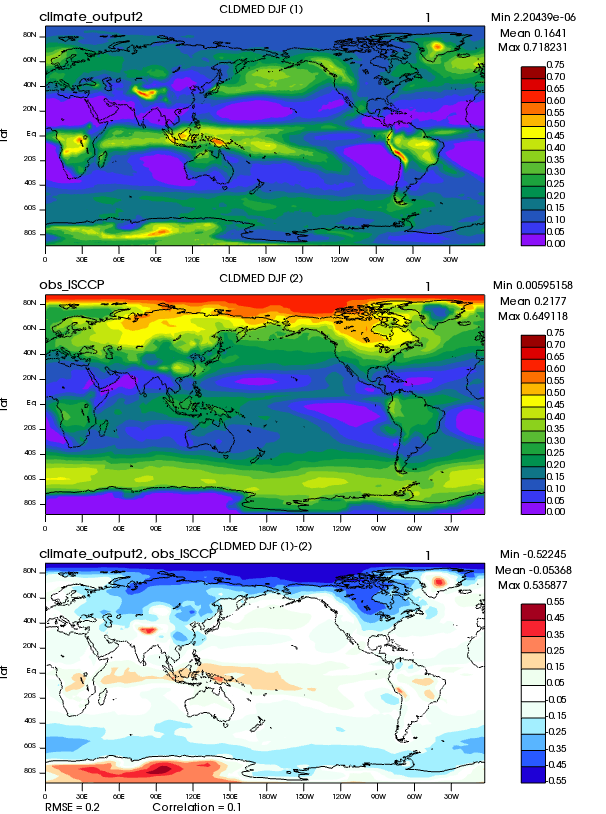
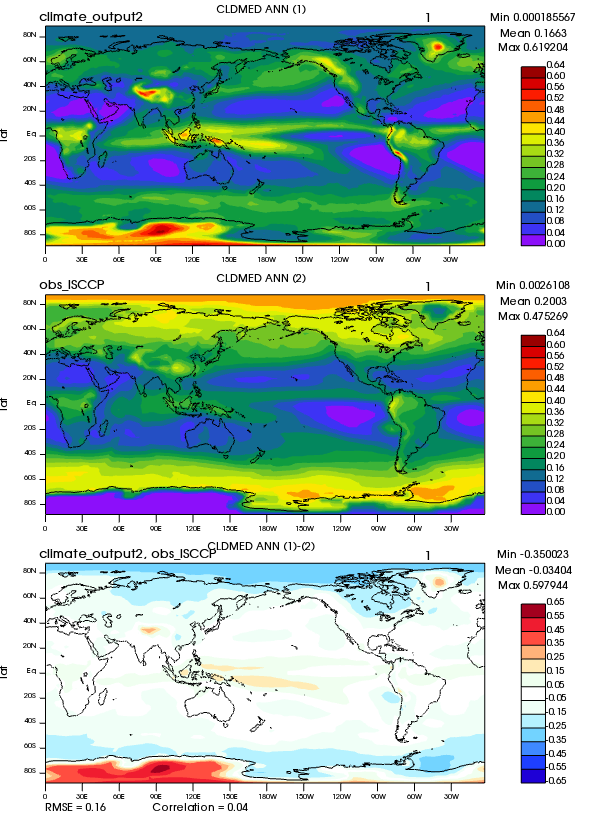
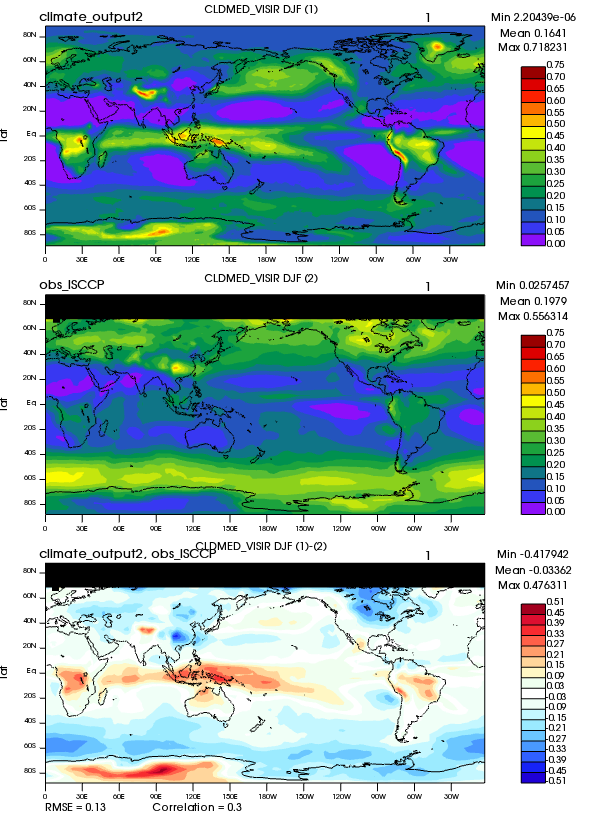
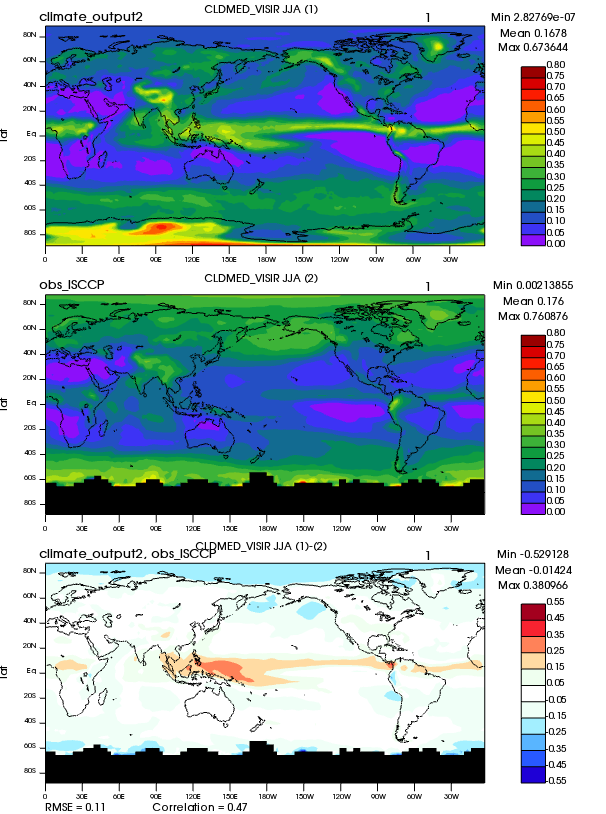
| CLDMED | Mid cloud amount (IR clouds) (Northern) | Plot | Plot | Plot |
| CLDLOW | Low cloud amount (IR clouds) | Plot | Plot | Plot |
| CLDTOT | Mid cloud amount (IR clouds) | Plot | Plot | Plot |
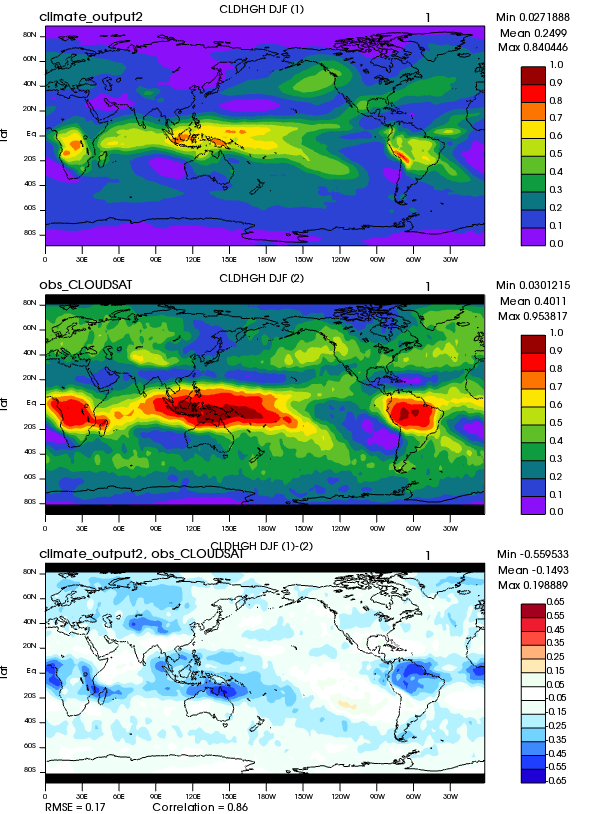
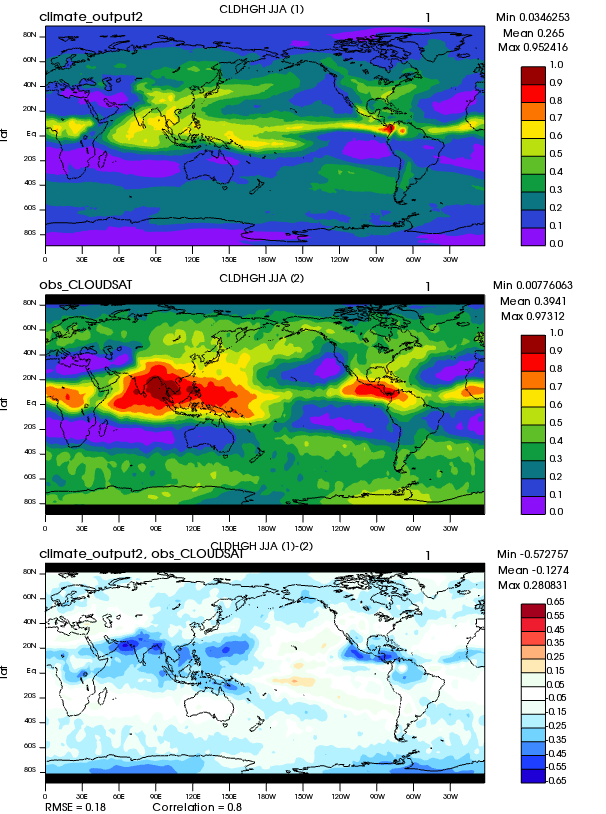
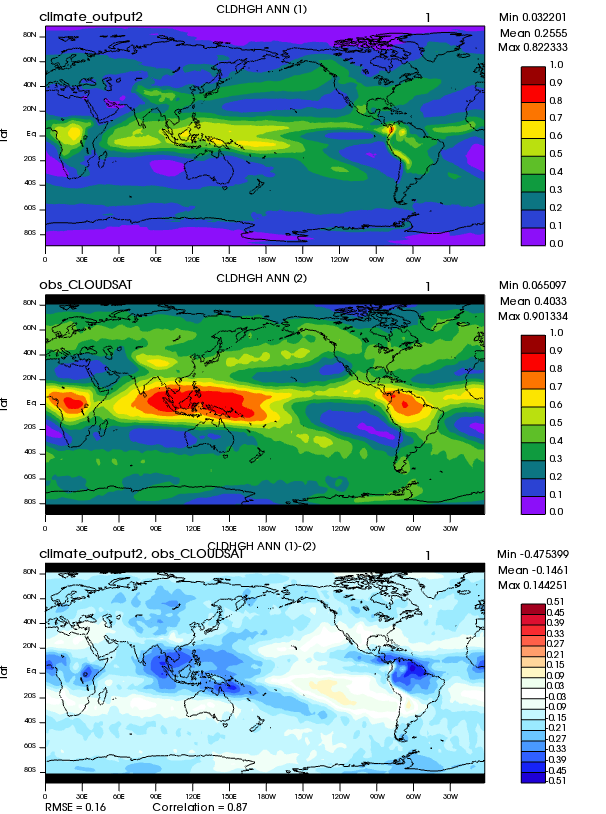
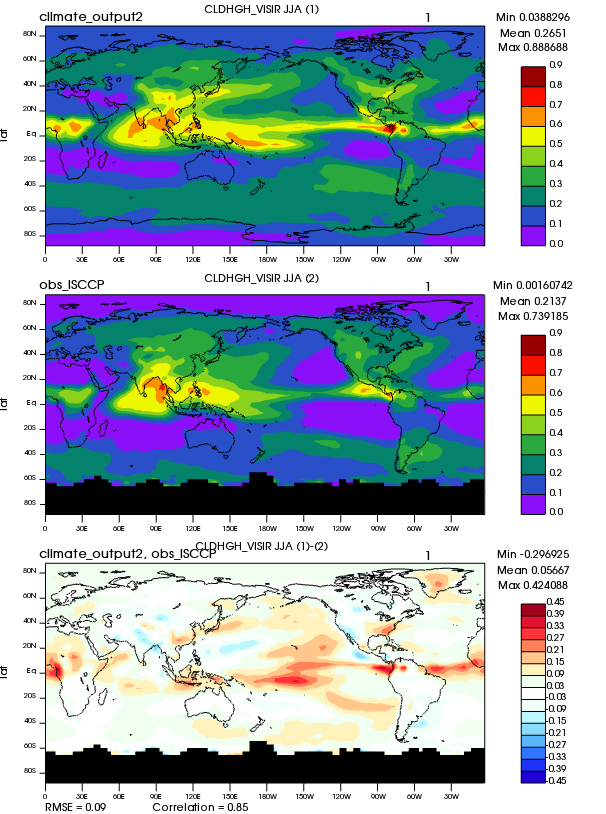
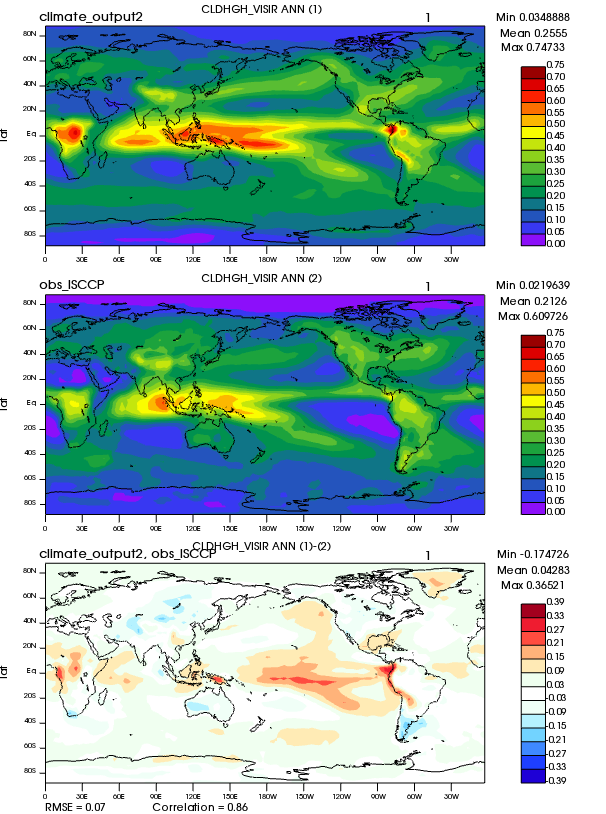
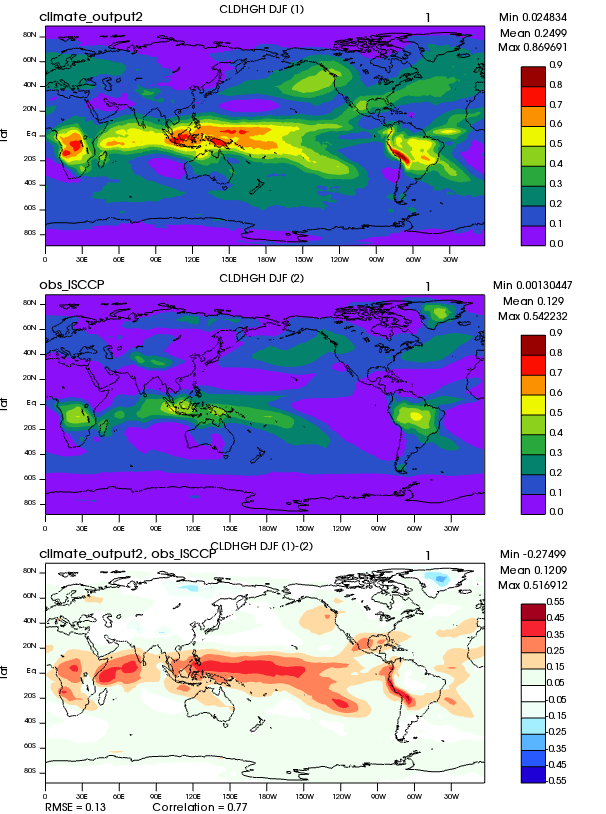
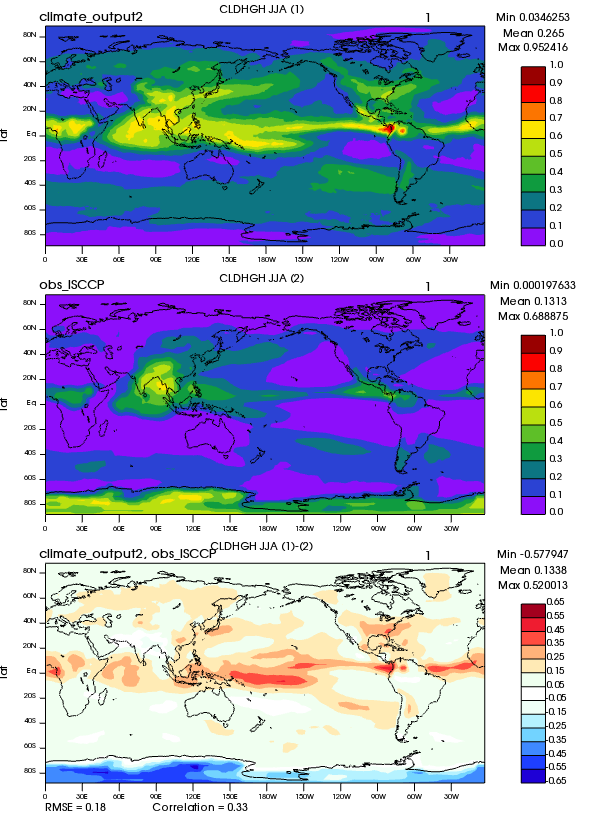
| CLDHGH | High cloud amount (IR clouds) | Plot | Plot | Plot |
| LHFLX | Surface latent heat flux | Plot | Plot | Plot |
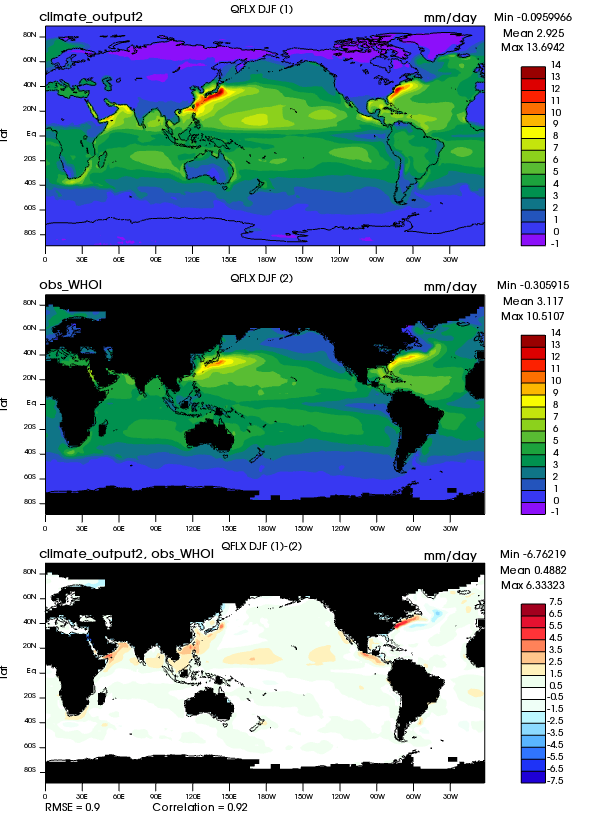
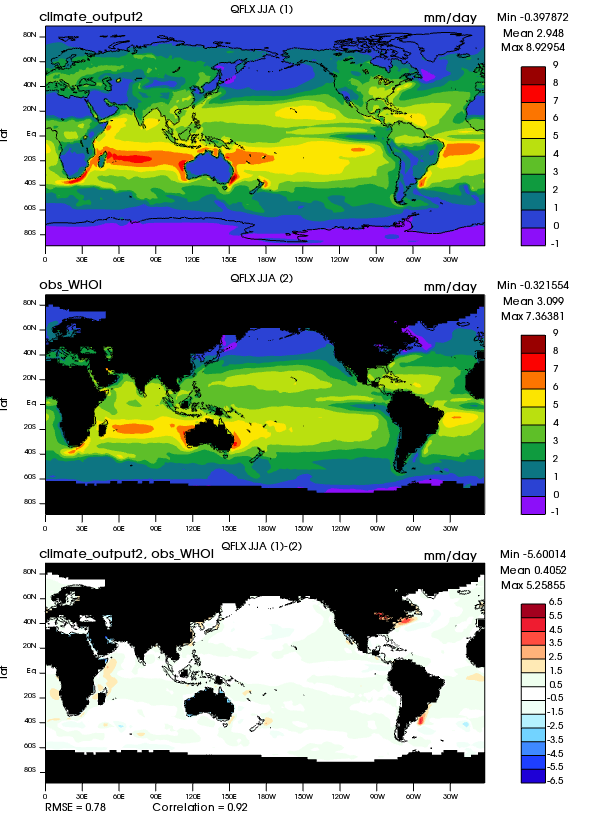
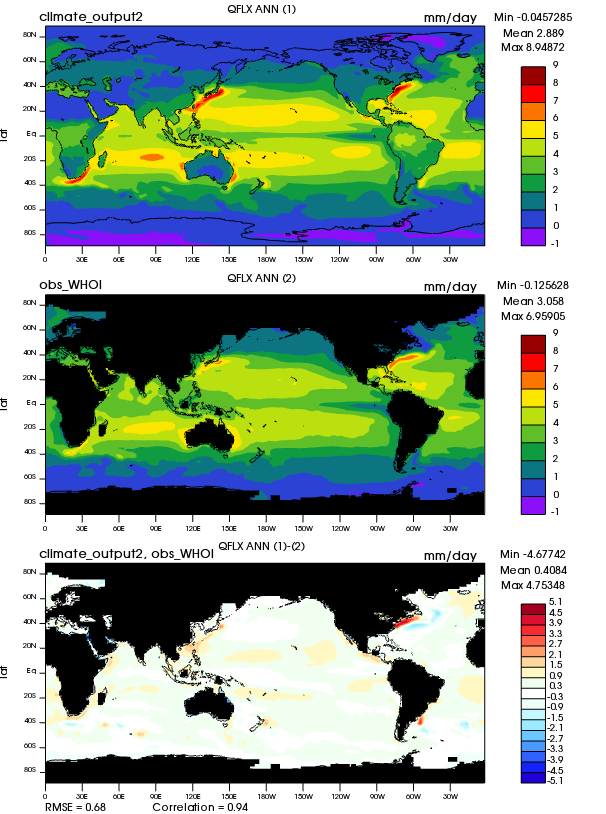
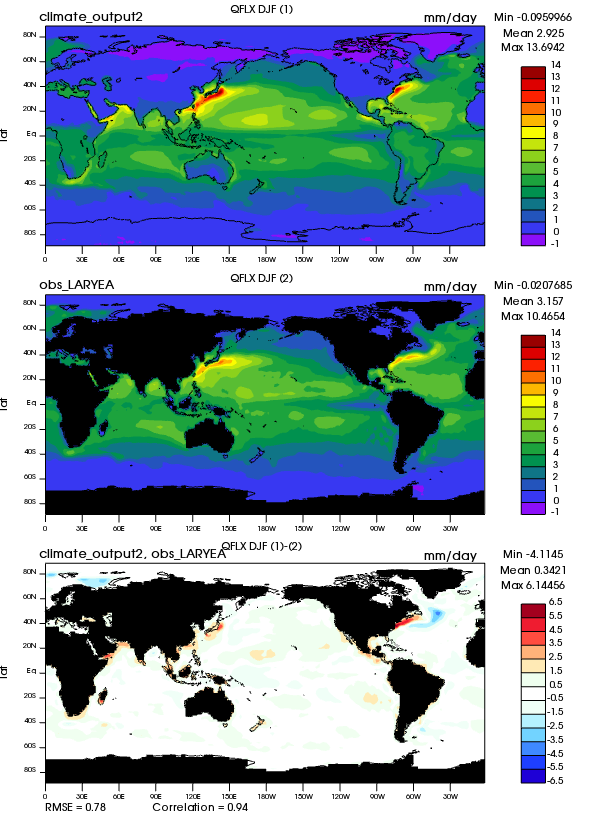
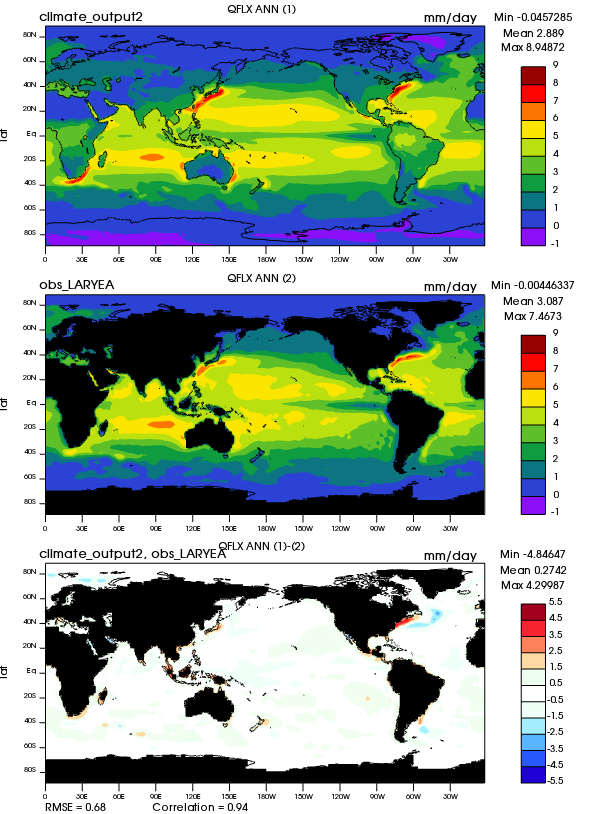
| QFLX | Surface water flux (Northern) | Plot | Plot | Plot |
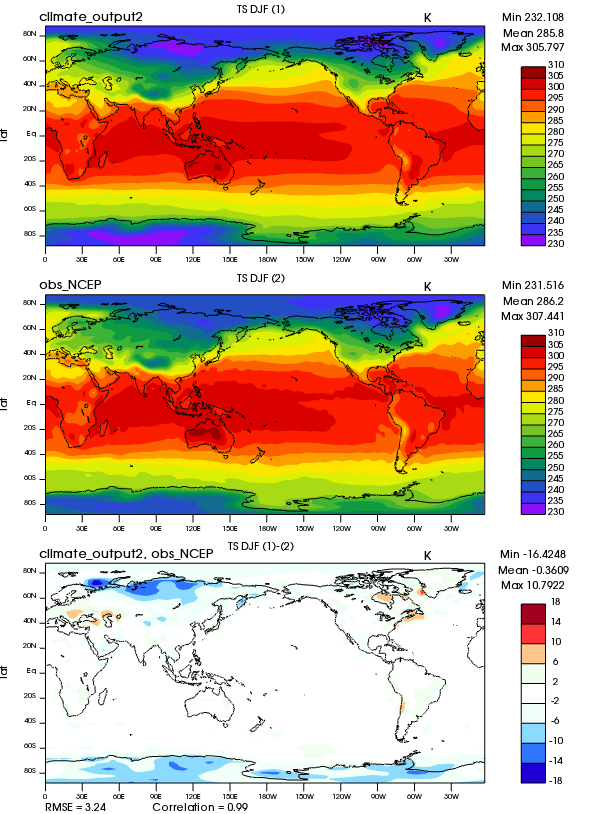
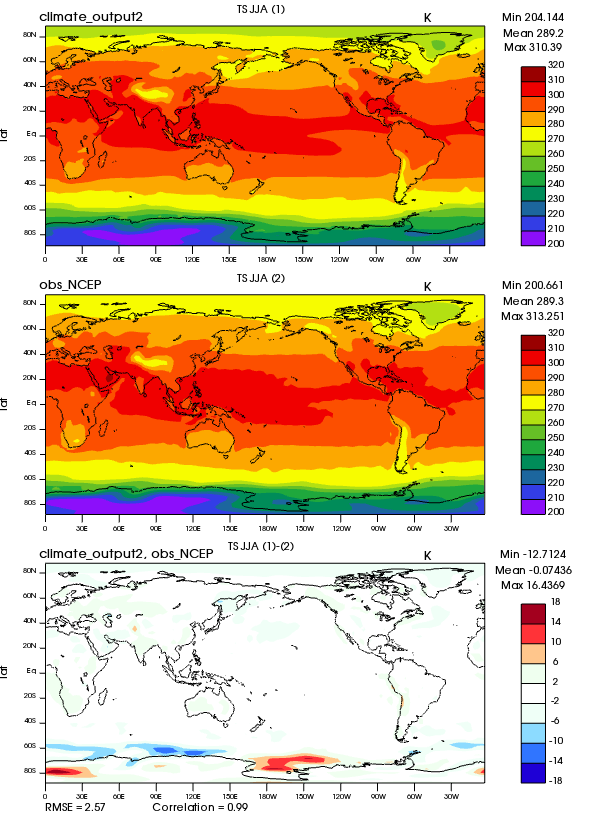
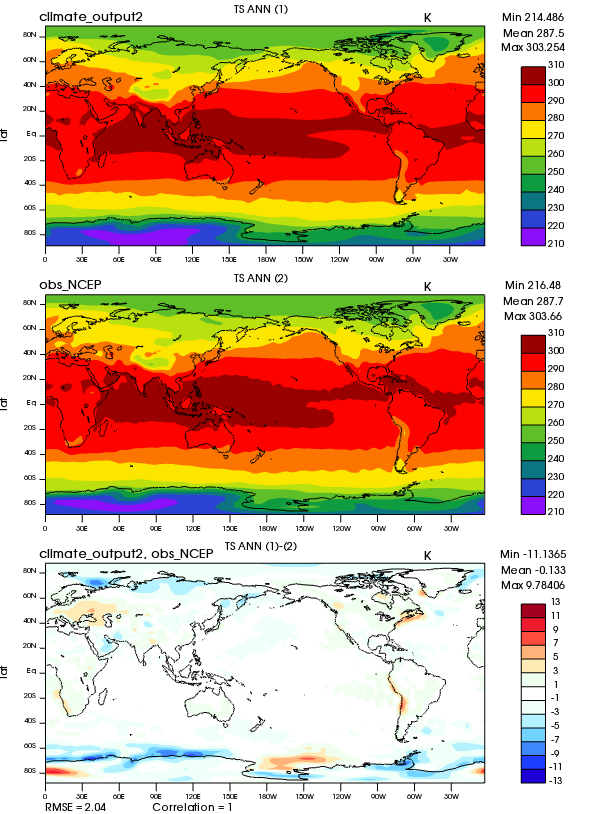
| TS | Surface temperature | Plot | Plot | Plot |
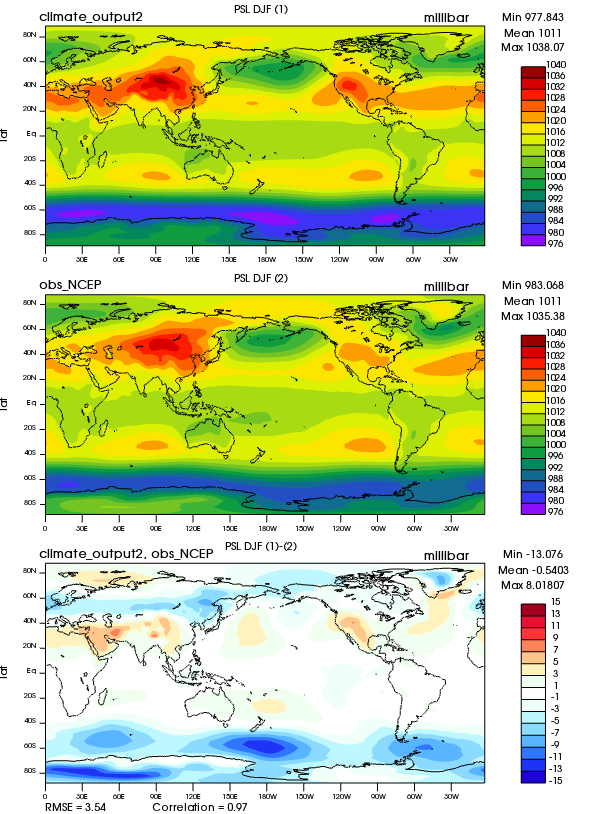
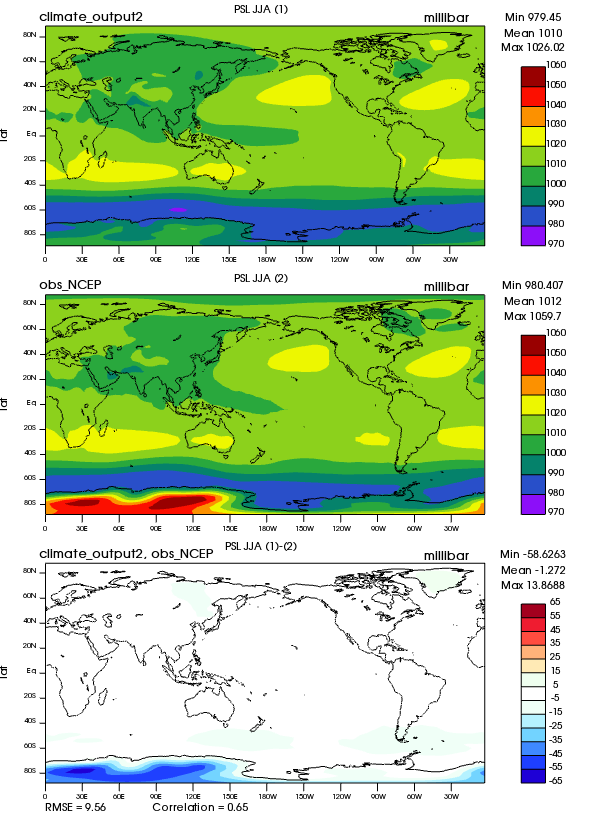
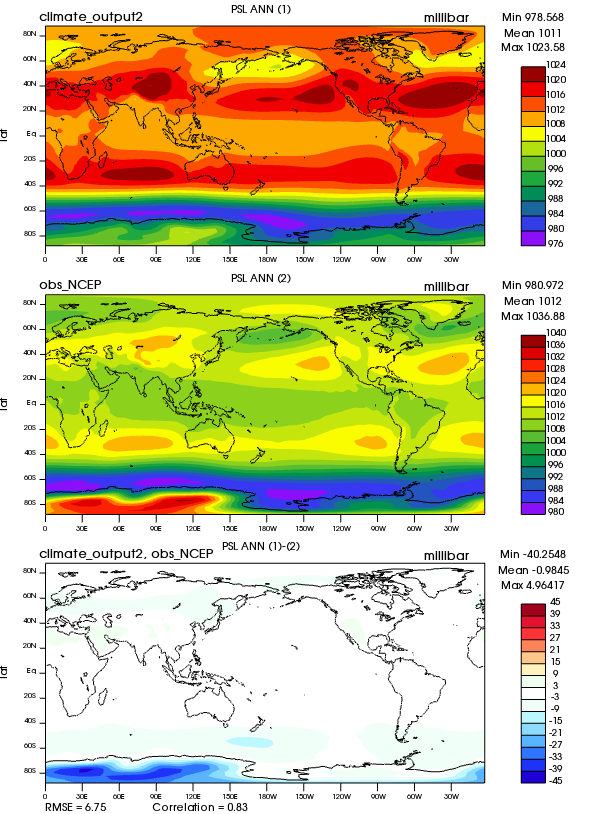
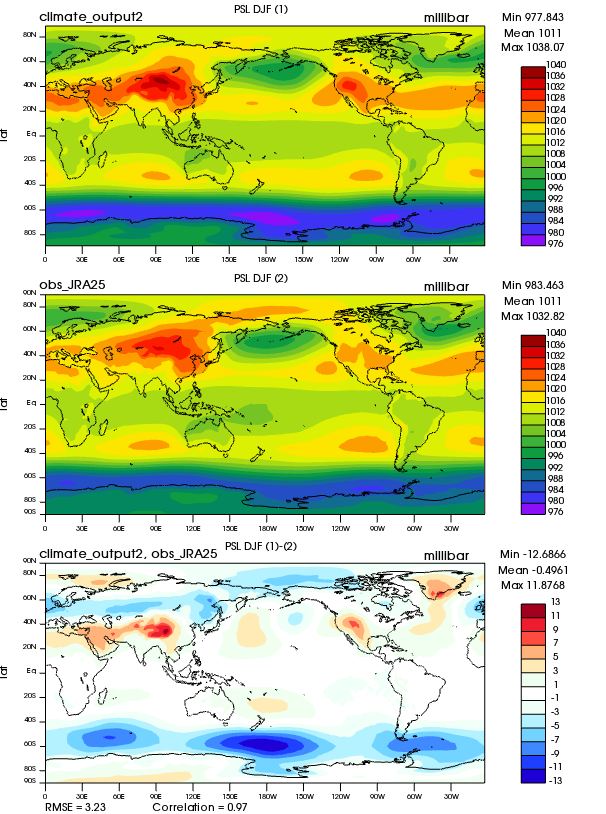
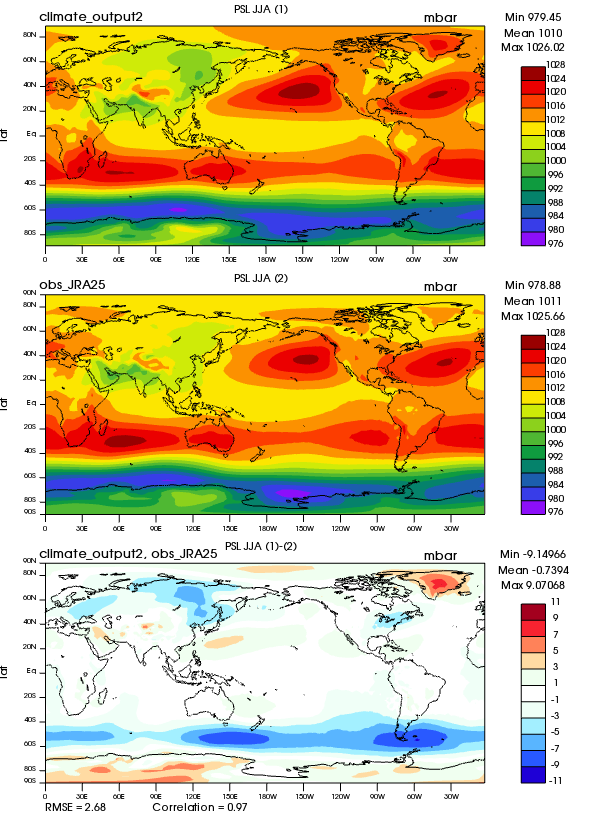
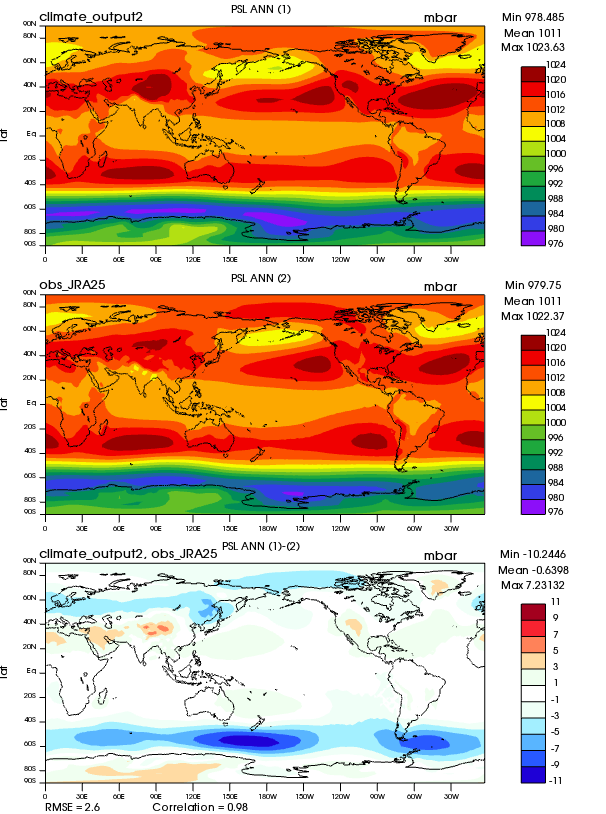
| PSL | Sea-level pressure (Northern) | Plot | Plot | Plot |
| TTRP | Tropopause temperature | Plot | Plot | Plot |
| Z3 | Geopotential height (Northern) | Plot | Plot | Plot |
| Z3 | Geopotential height (Northern) | Plot | Plot | Plot |
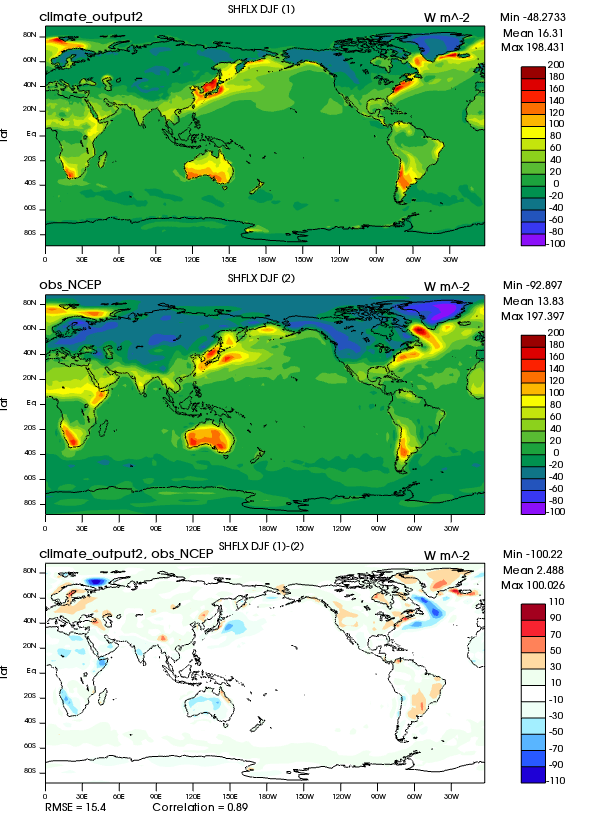
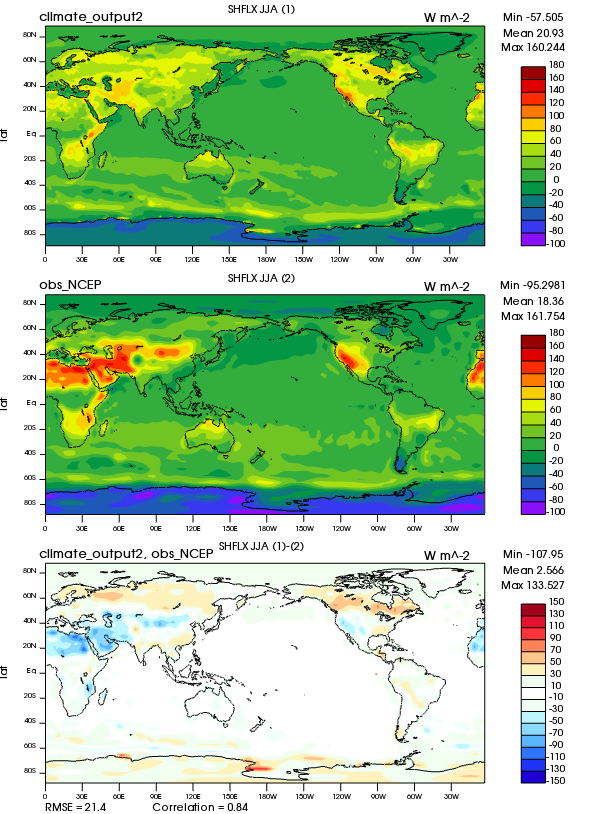
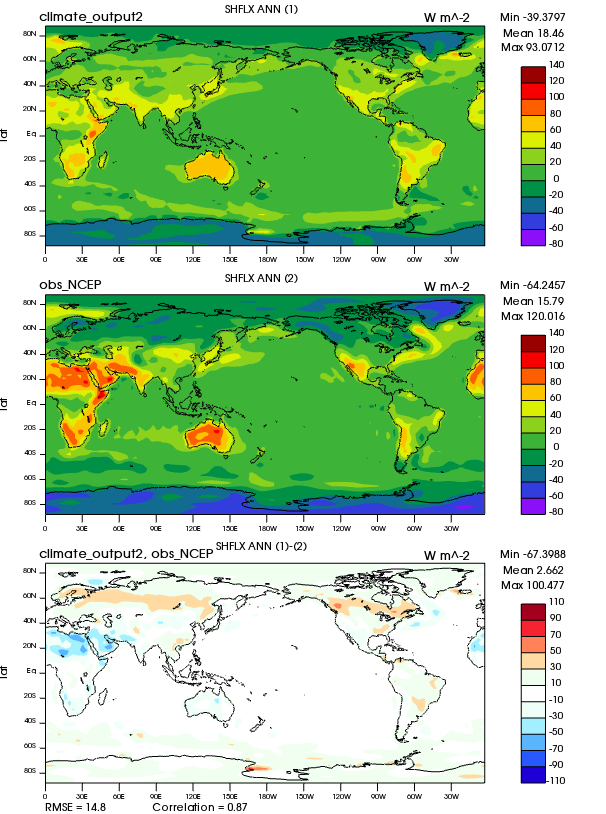
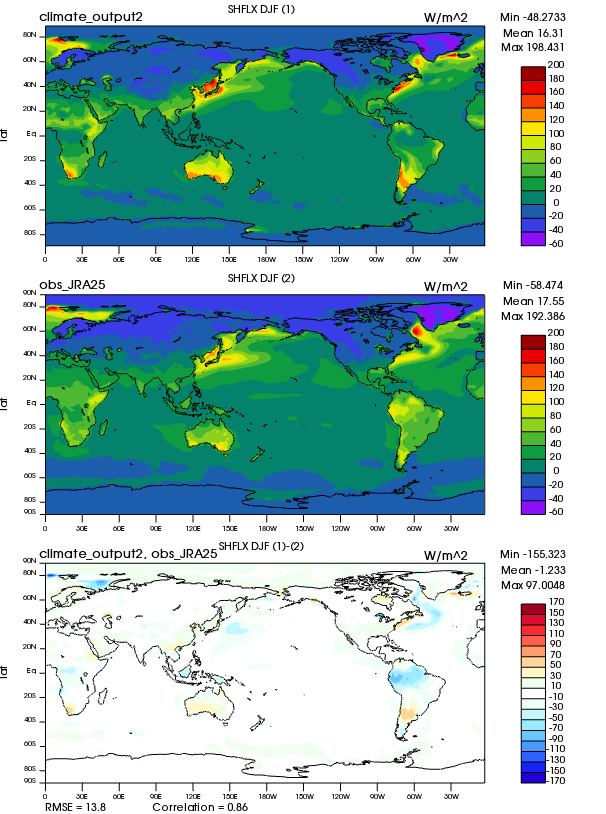
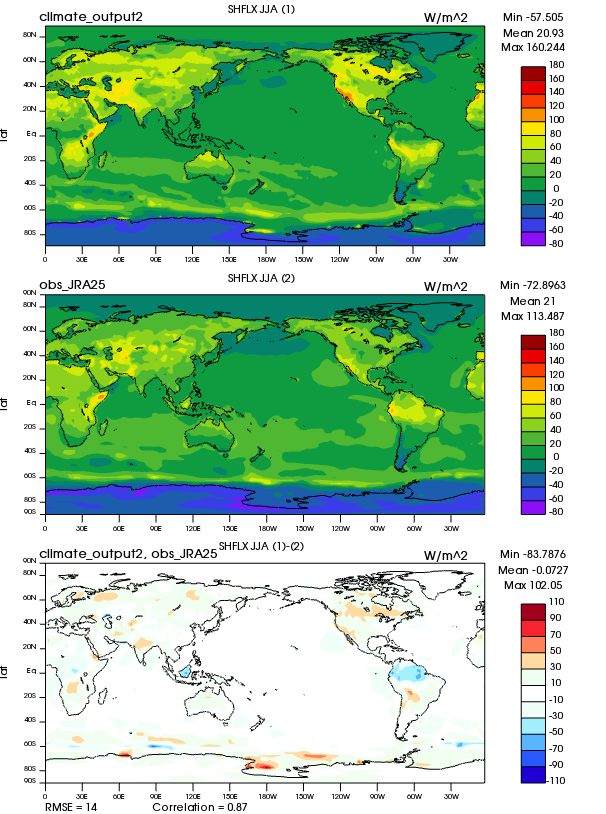
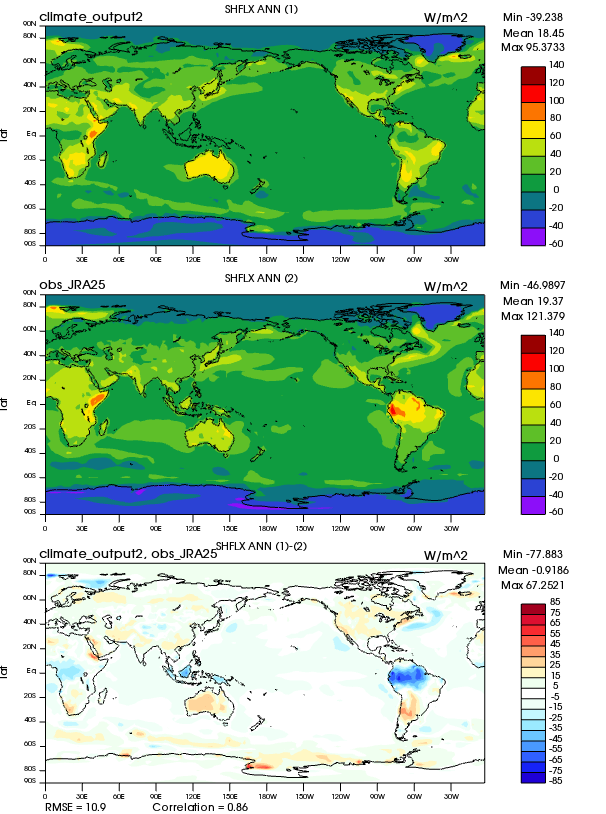
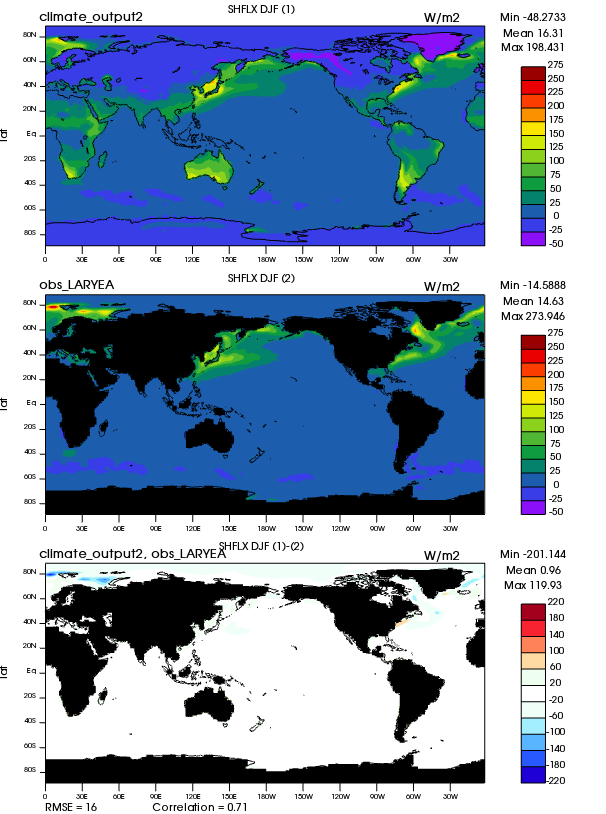
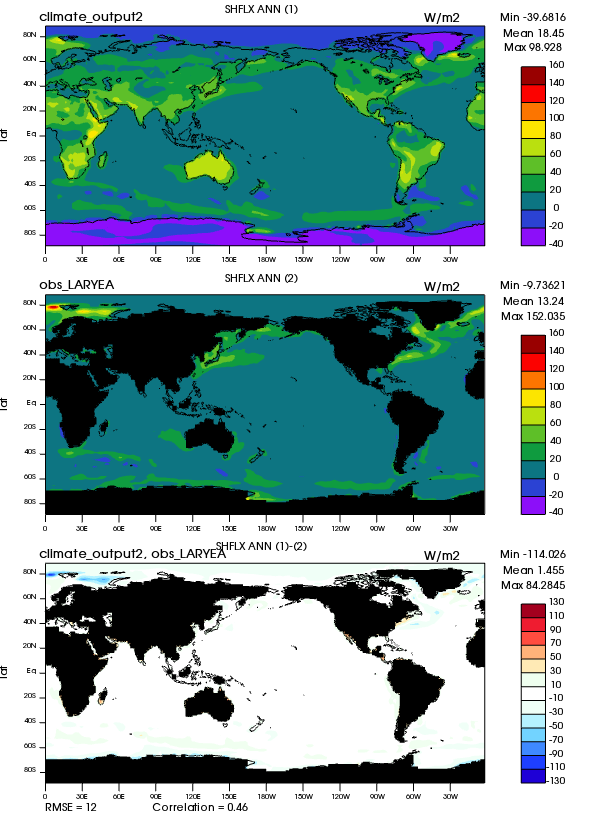
| SHFLX | Surface sensible heat flux | Plot | Plot | Plot |
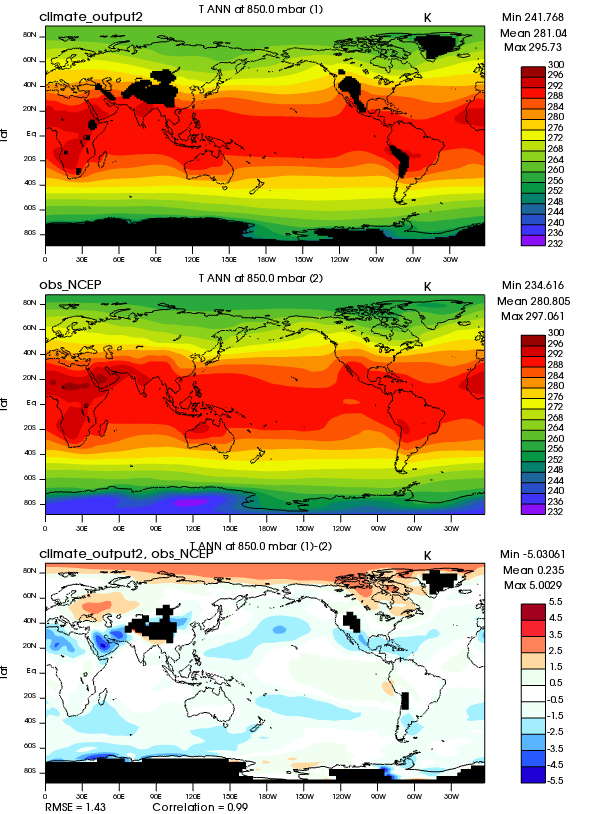
| T | Temperature | Plot | Plot | Plot |
| T | Temperature | Plot | Plot | Plot |
| U | Zonal Wind | Plot | Plot | Plot |
| PREH2O | Total precipitable water | Plot | Plot | Plot |
| PREH2O | Total precipitable water | Plot | Plot | Plot |
| PSL | Sea-level pressure (Northern) | Plot | Plot | Plot |
| Z3 | Geopotential height (Northern) | Plot | Plot | Plot |
| Z3 | Geopotential height (Northern) | Plot | Plot | Plot |
| LHFLX | Surface latent heat flux | Plot | Plot | Plot |
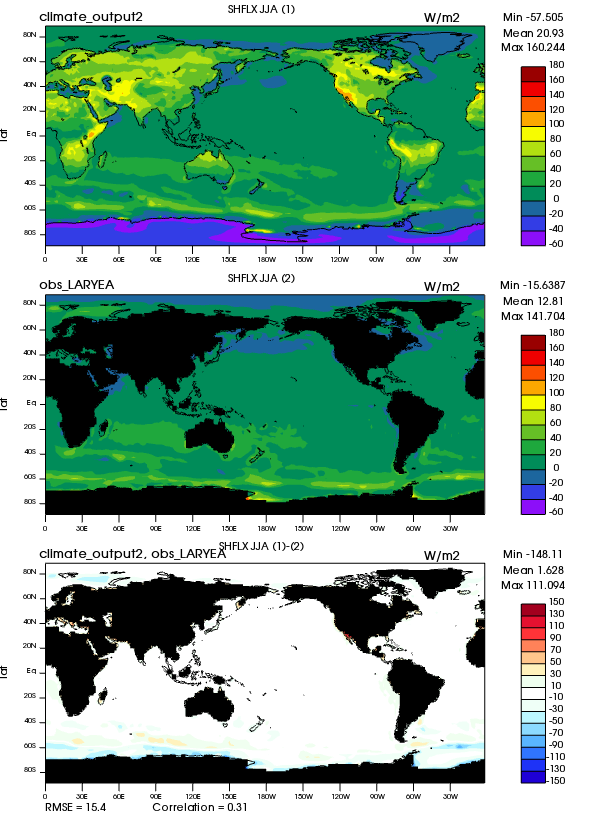
| SHFLX | Surface sensible heat flux | Plot | Plot | Plot |
| TREFHT | 2-meter air temperature (land) | Plot | Plot | Plot |
| T | Temperature | Plot | Plot | Plot |
| T | Temperature | Plot | Plot | Plot |
| U | Zonal Wind | Plot | Plot | Plot |
| PREH2O | Total precipitable water | Plot | Plot | Plot |
| PREH2O | Total precipitable water | Plot | Plot | Plot |
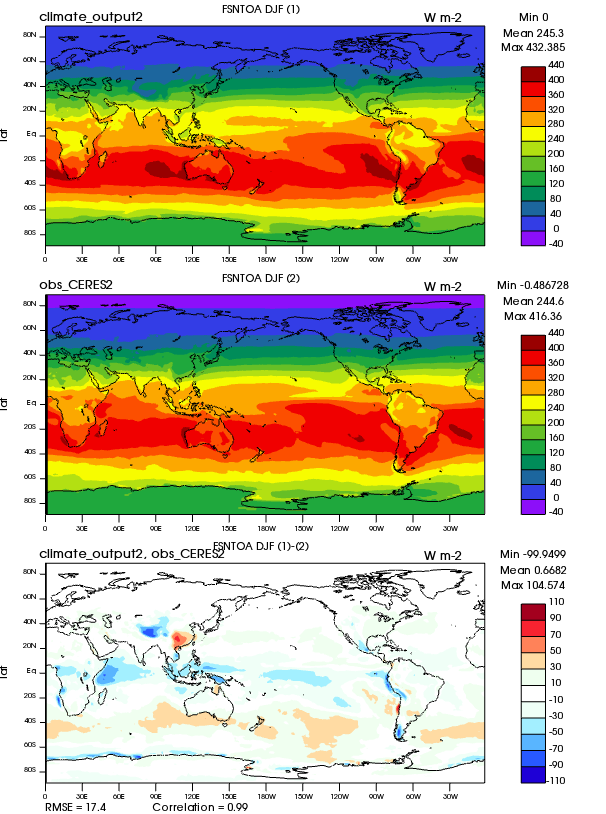
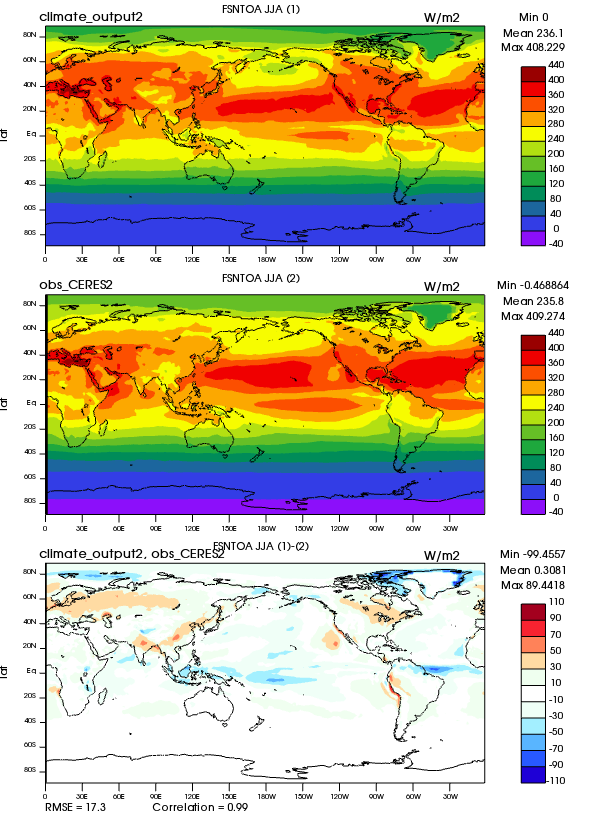
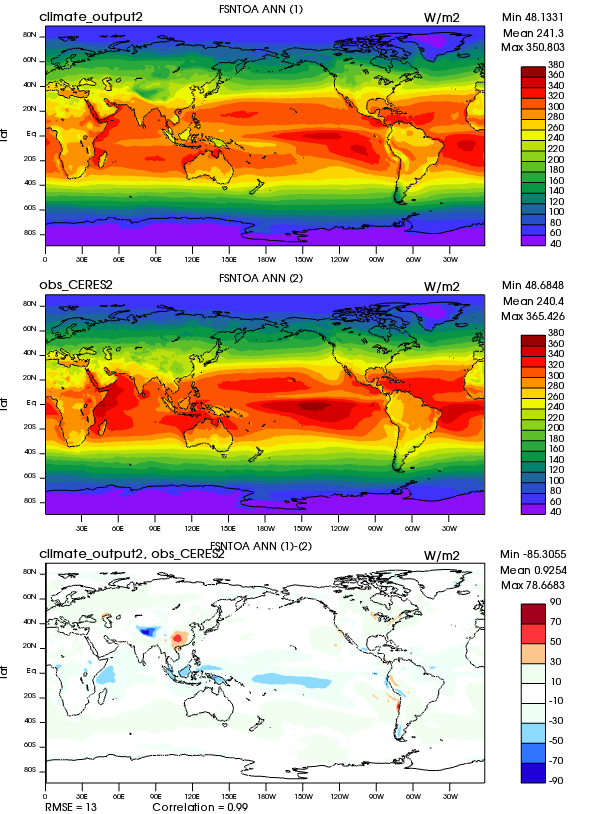
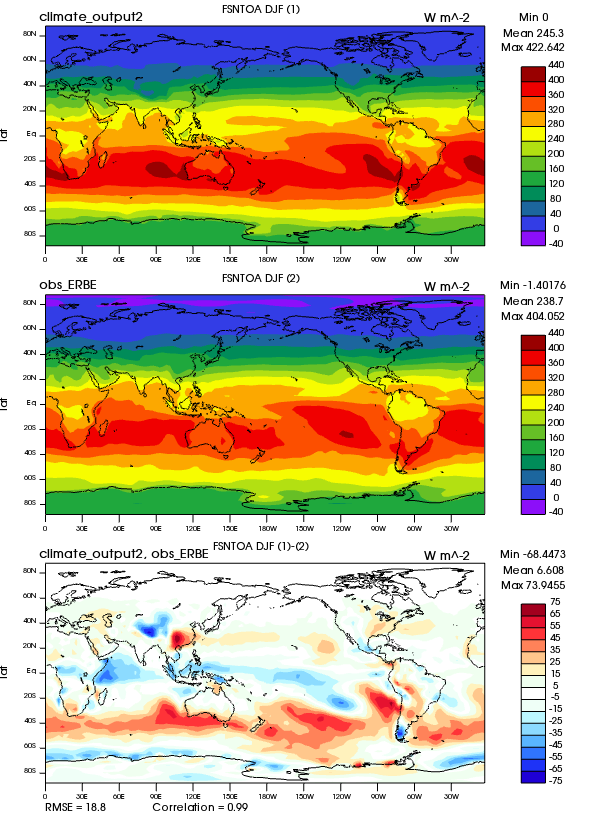
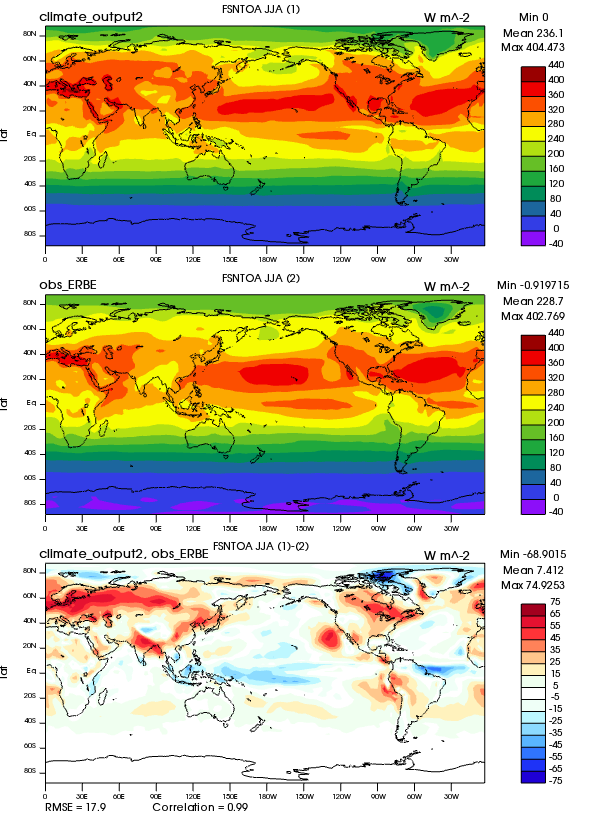
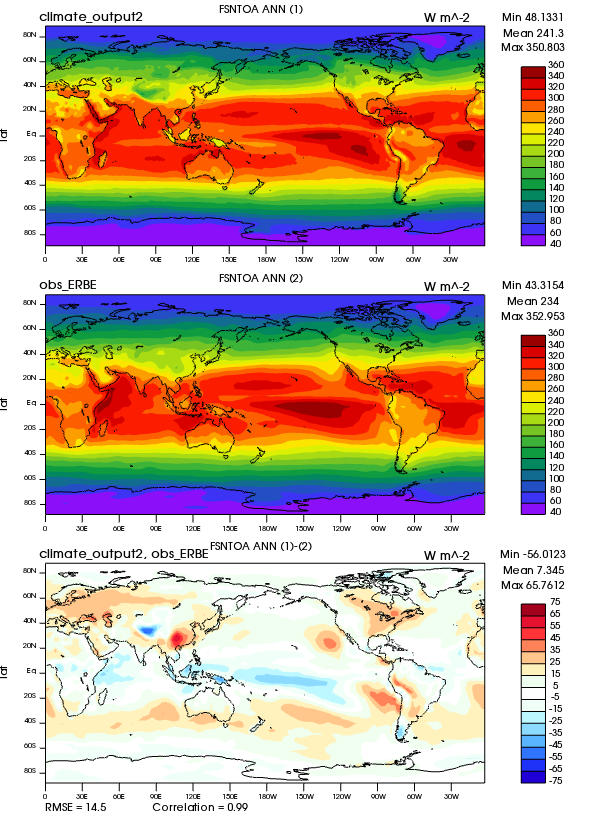
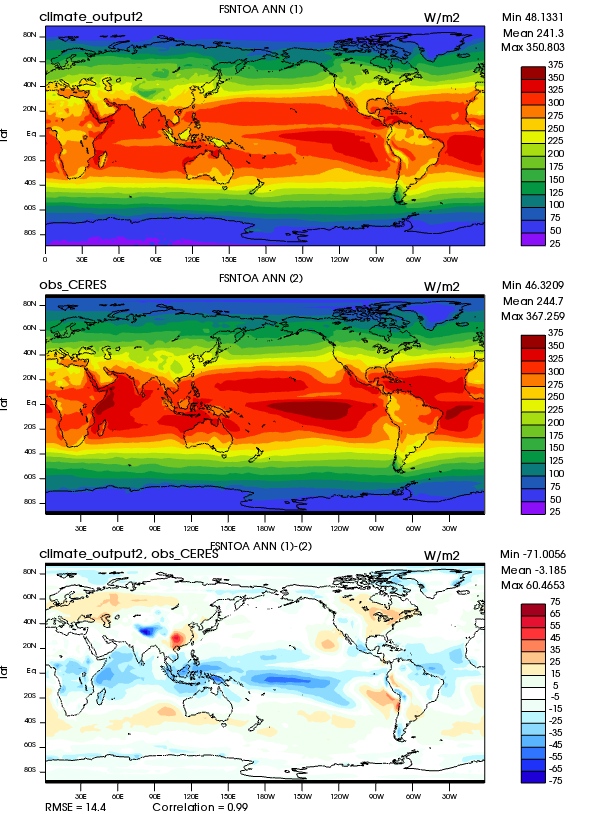
| FSNTOA | TOA net SW flux (Northern) | Plot | Plot | Plot |
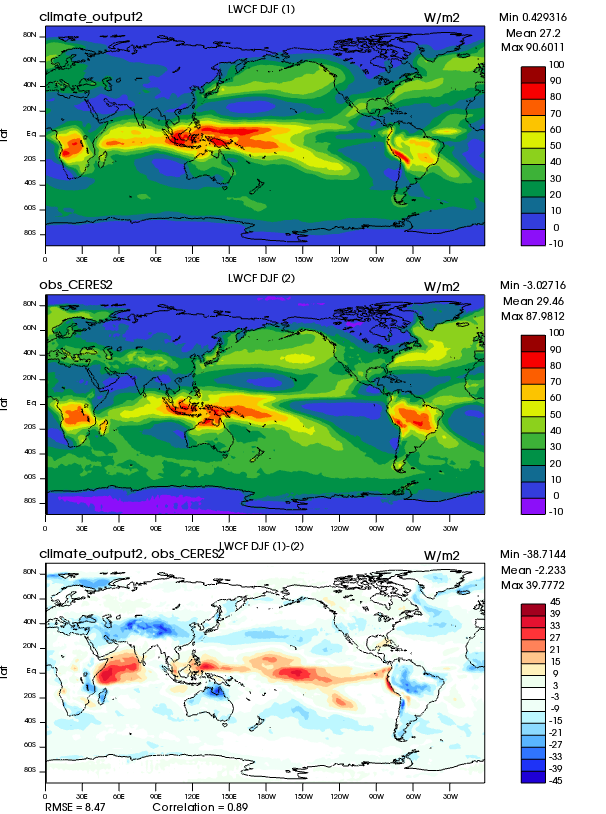
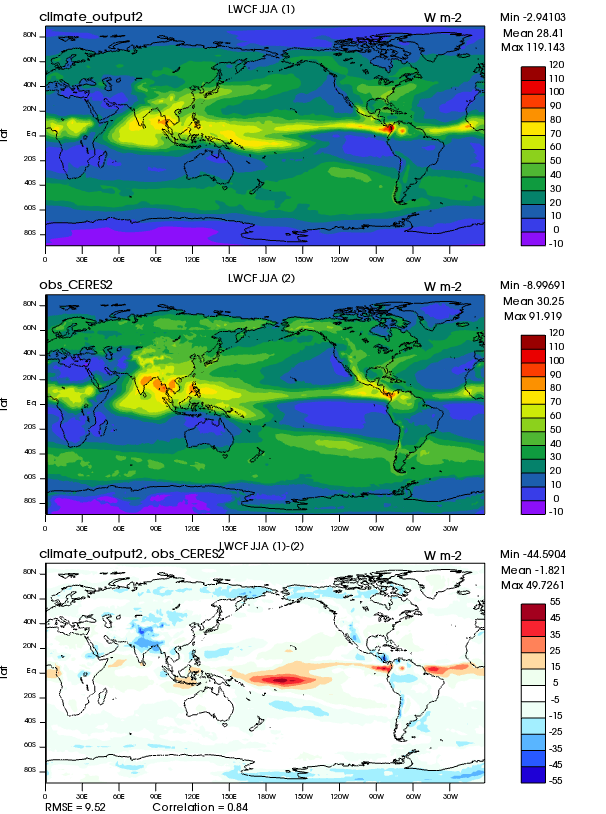
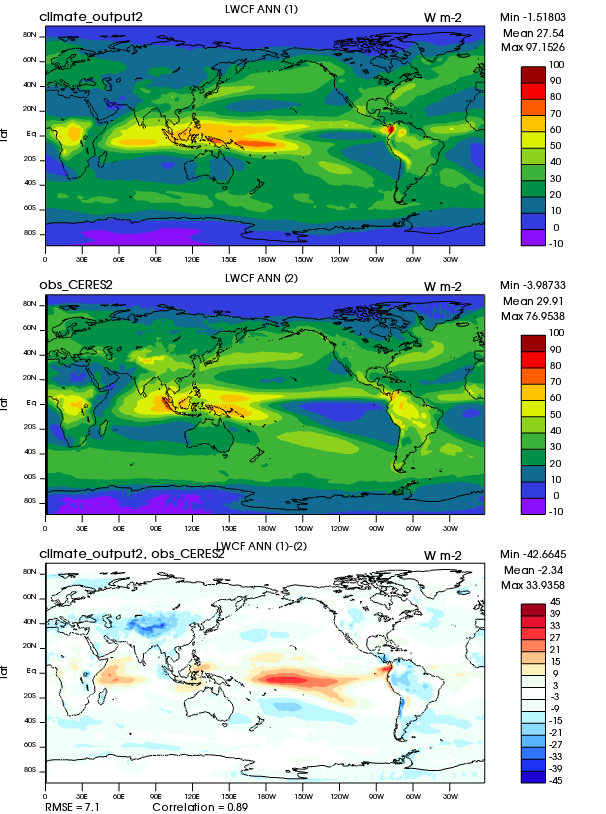
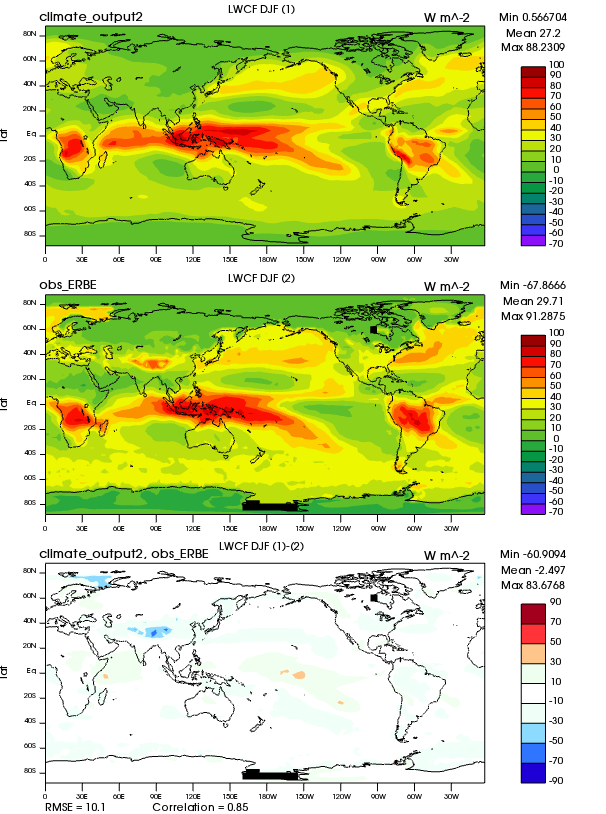
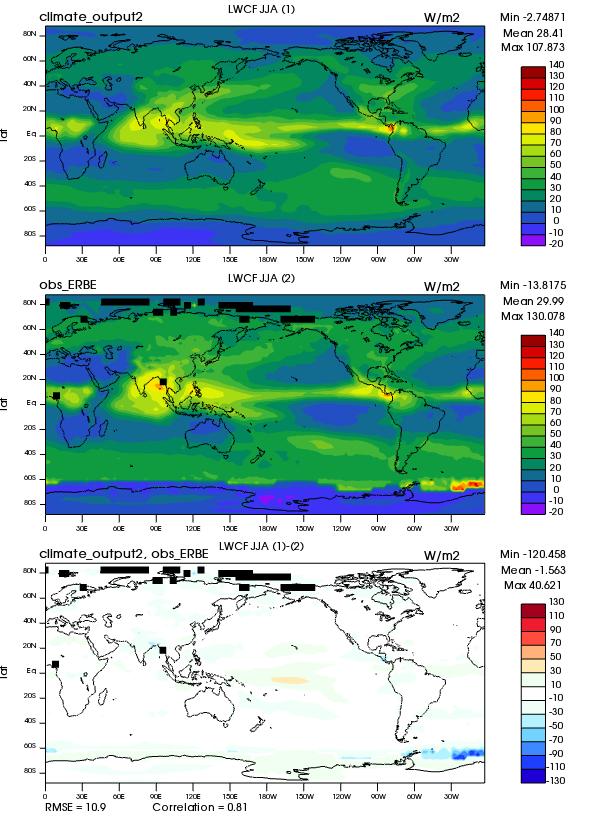
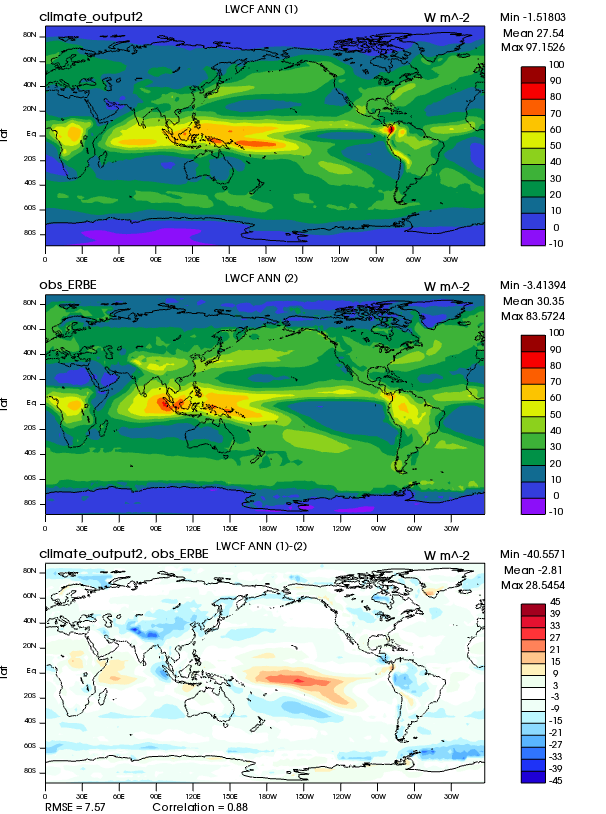
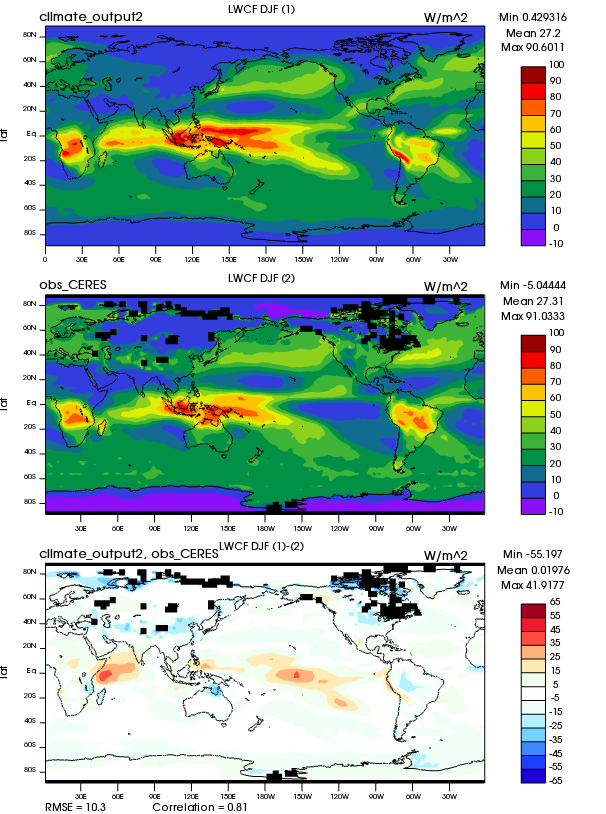
| LWCF | TOA longwave cloud forcing | Plot | Plot | Plot |
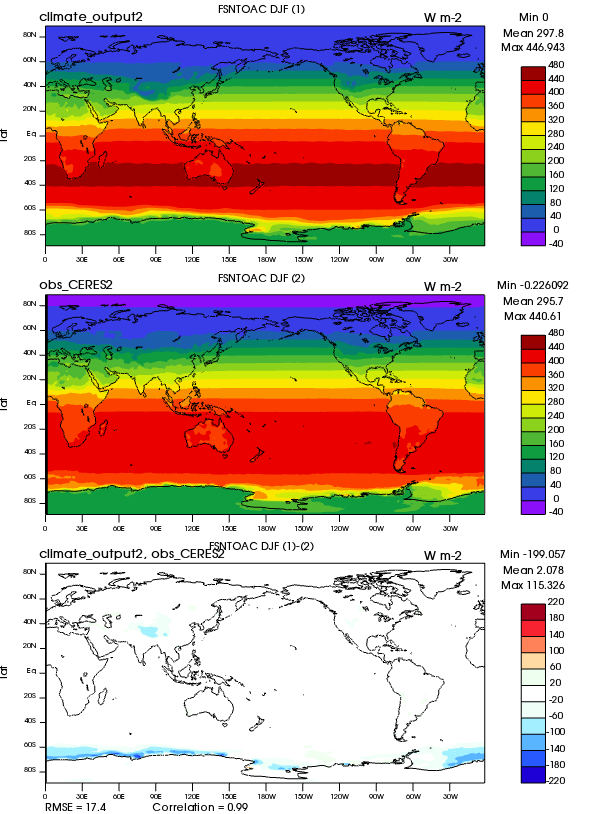
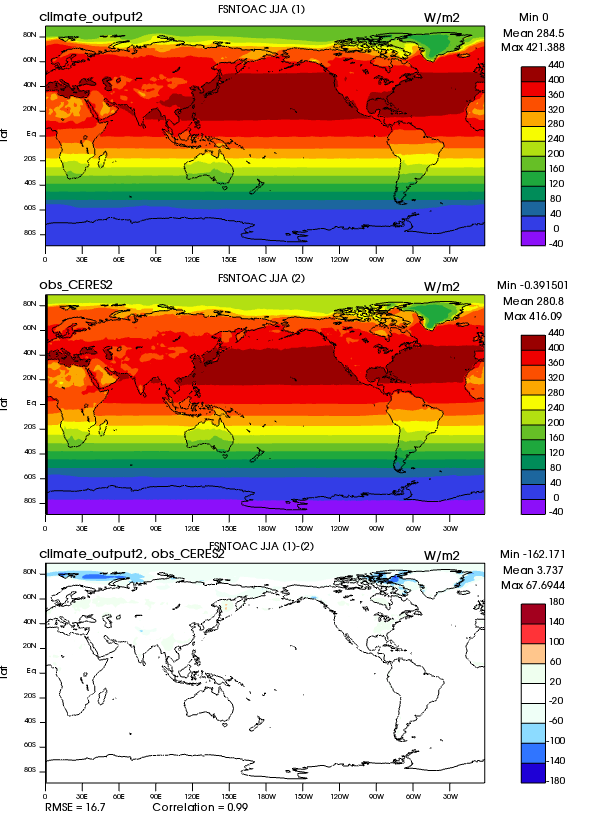
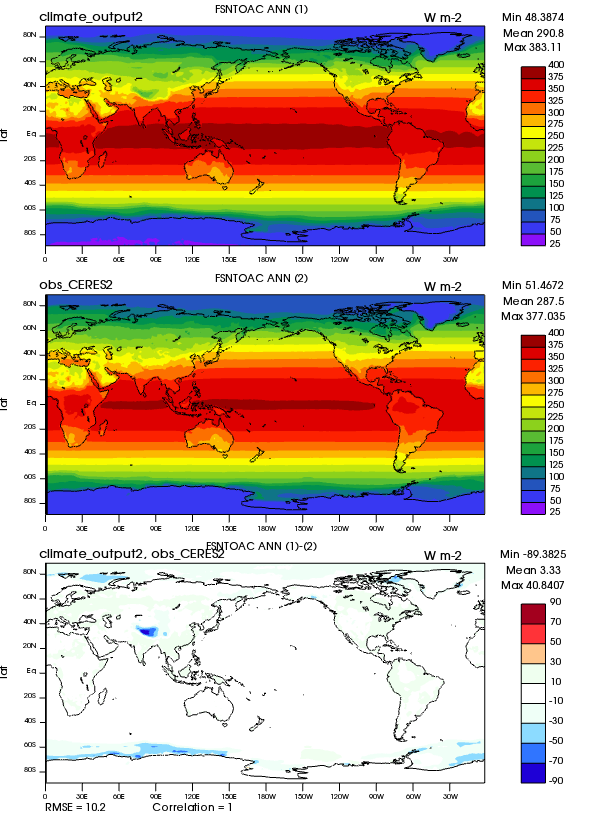
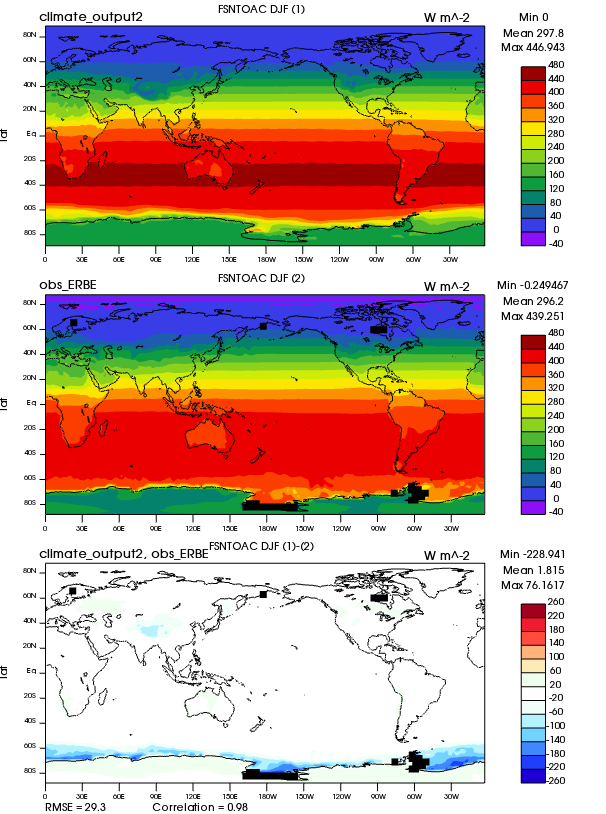
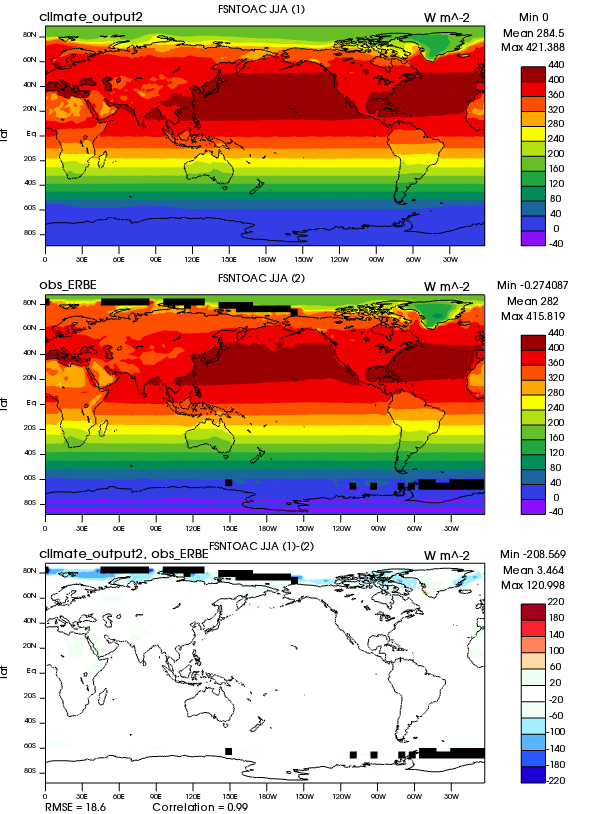
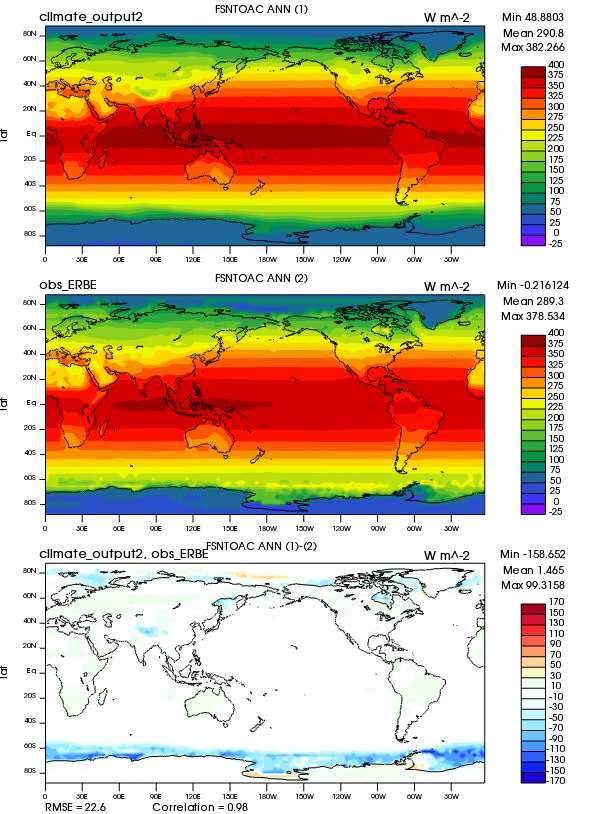
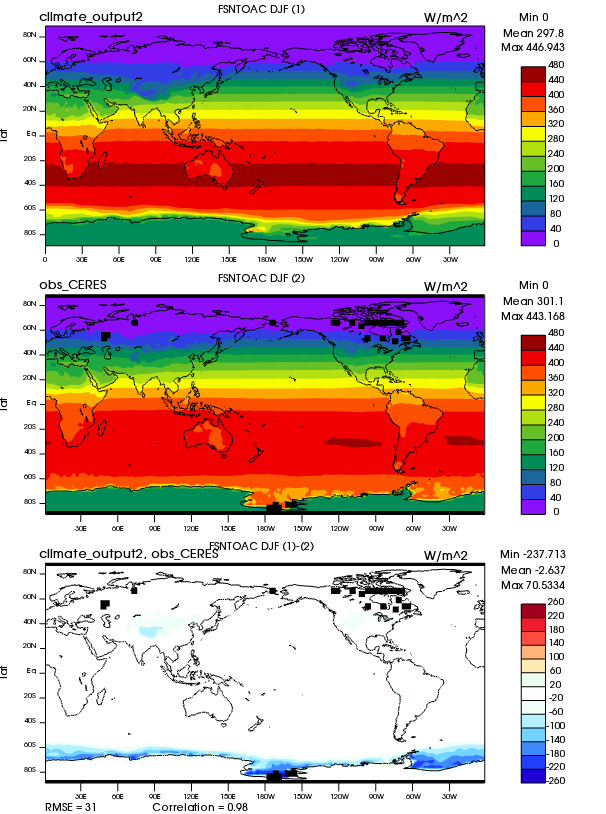
| FSNTOAC | TOA clearsky net SW flux (Northern) | Plot | Plot | Plot |
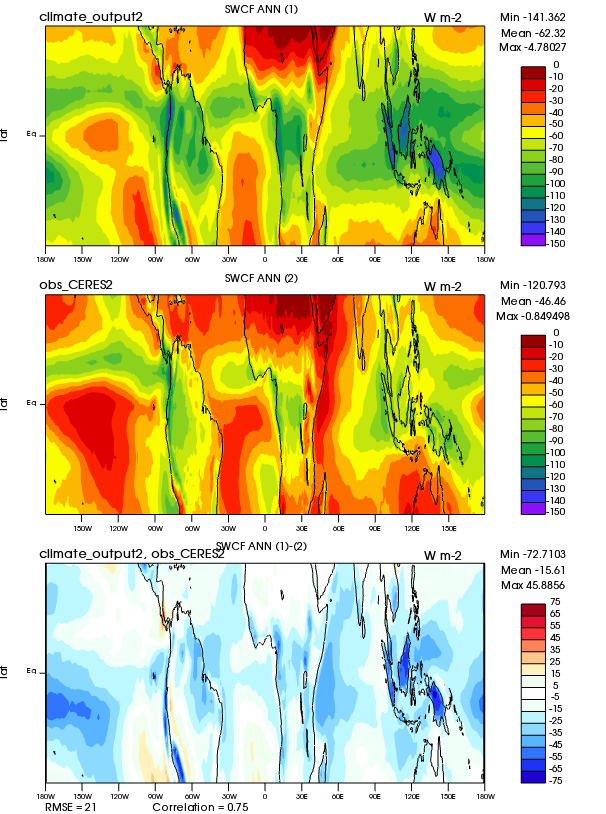
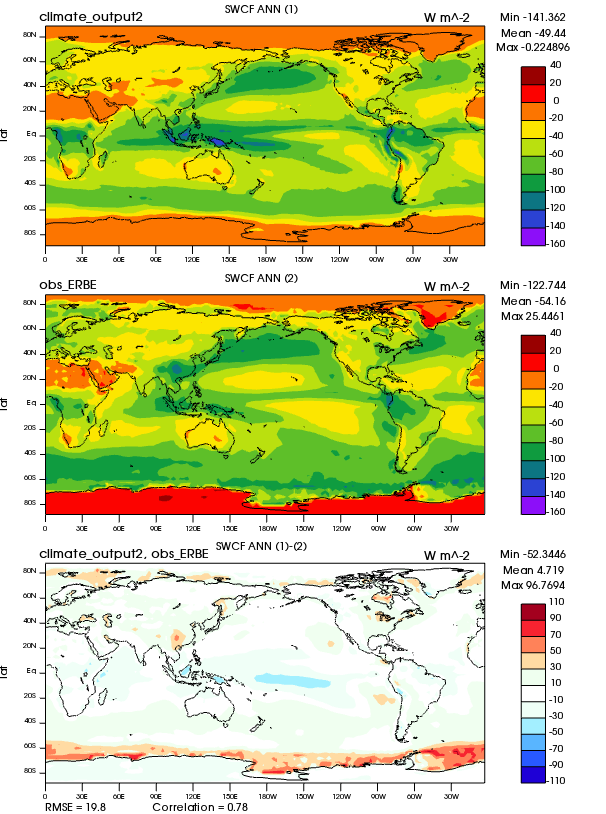
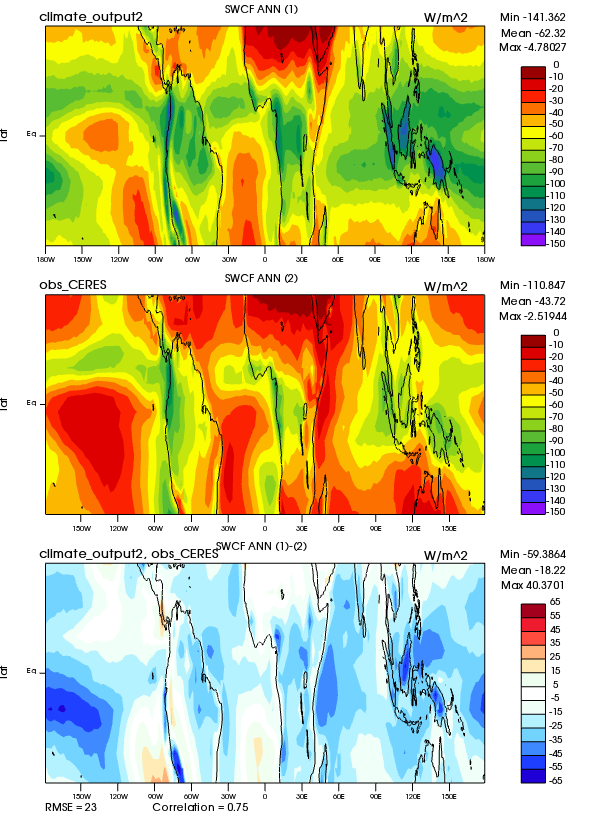
| SWCF | TOA shortwave cloud forcing | Plot | Plot | Plot |
| SWCF | TOA shortwave cloud forcing | Plot | Plot | Plot |
| ALBEDO | TOA albedo (Northern) | Plot | Plot | Plot |
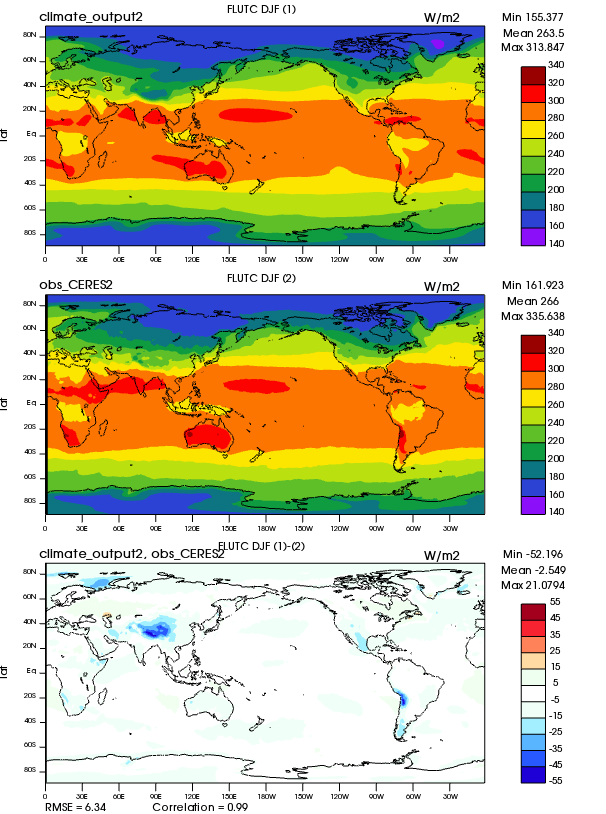
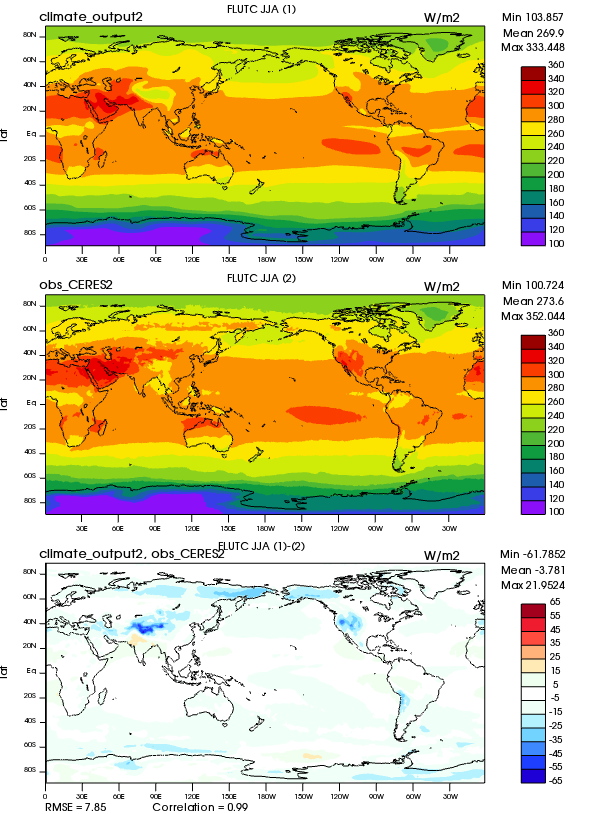
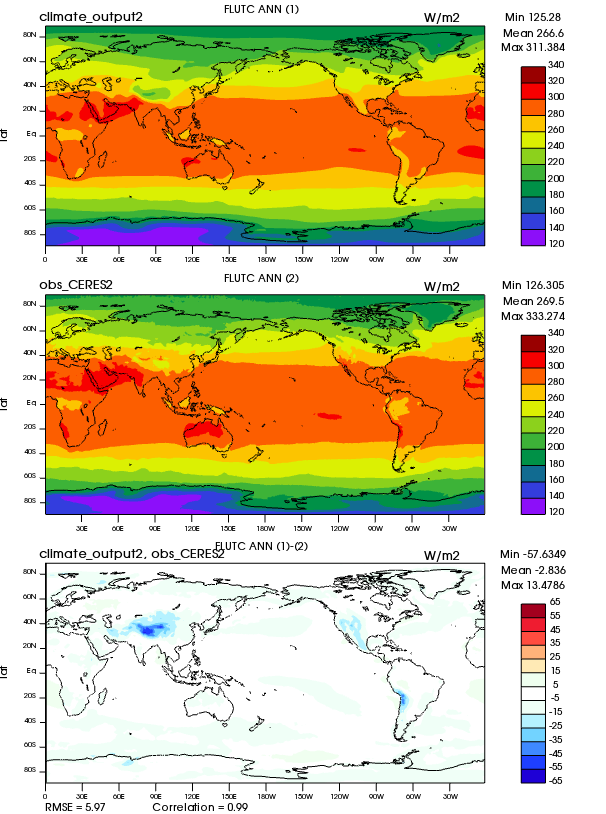
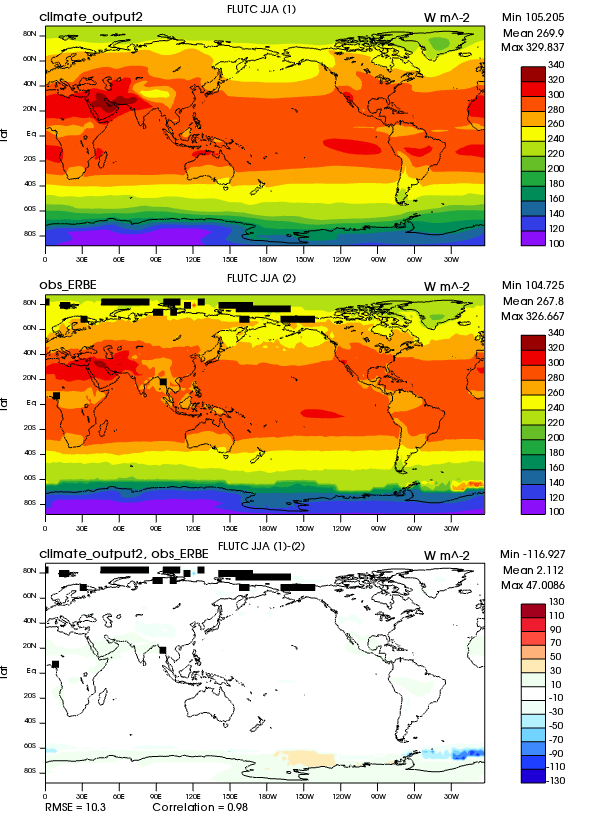
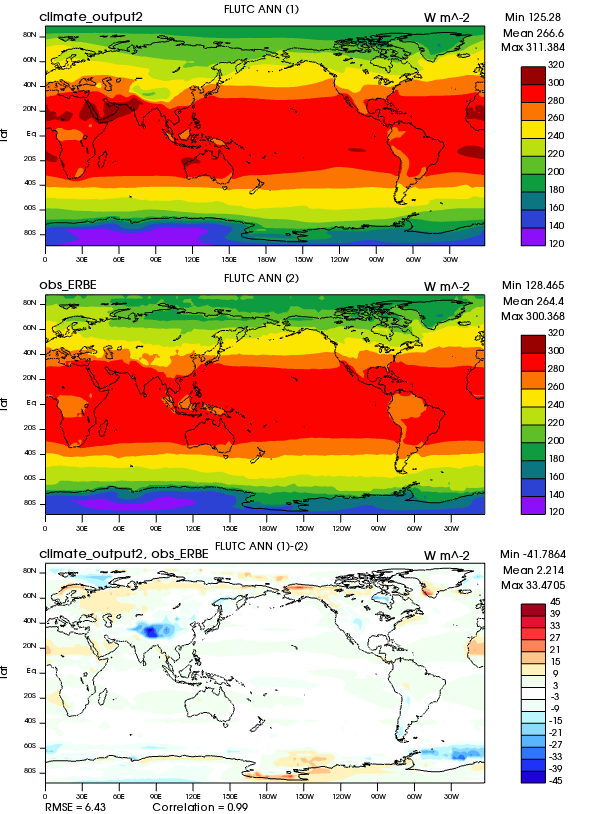
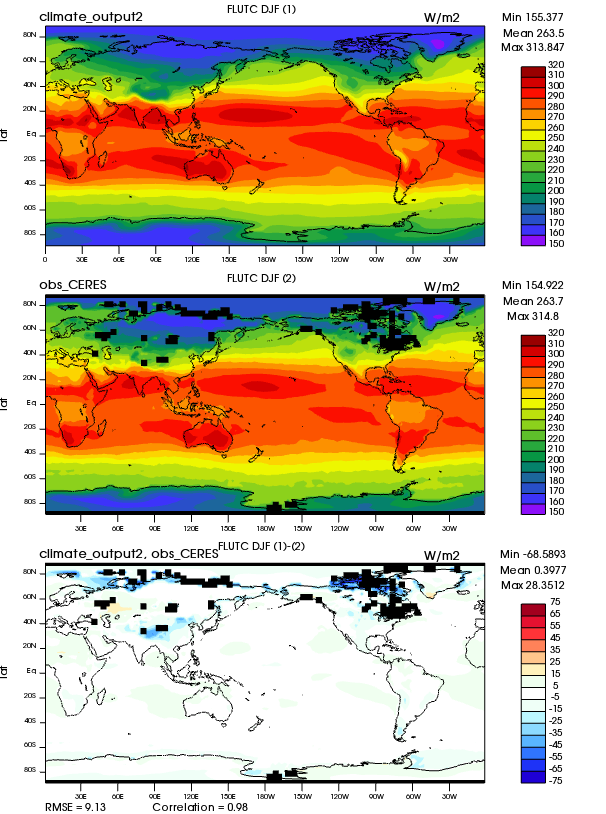
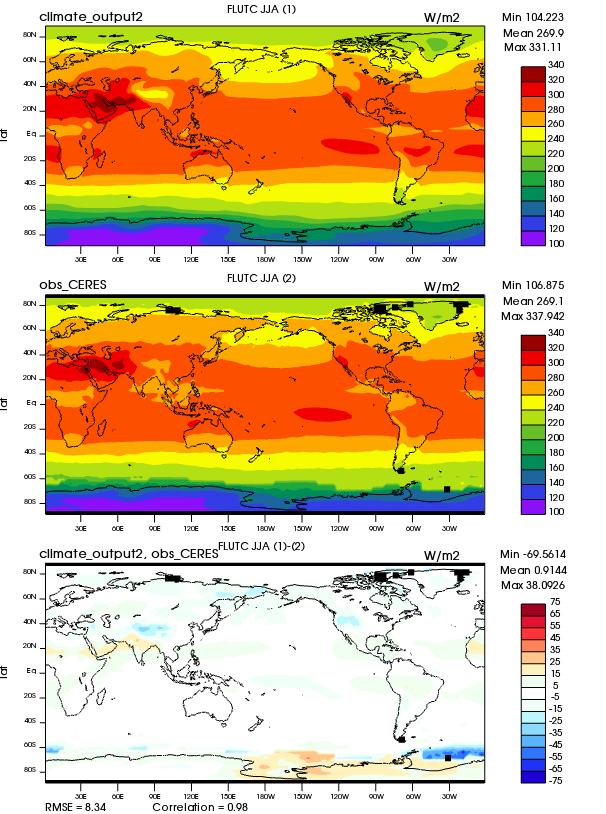
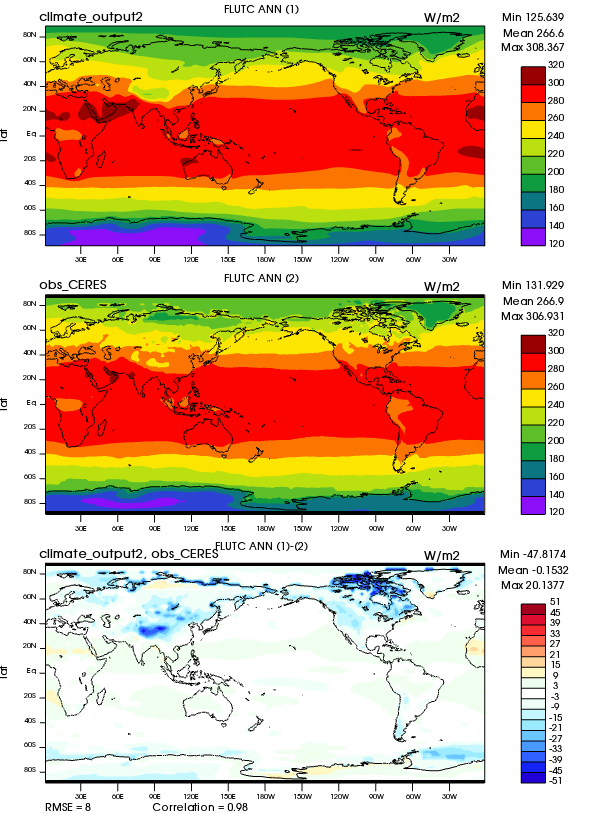
| FLUTC | TOA clearsky upward LW flux (Northern) | Plot | Plot | Plot |
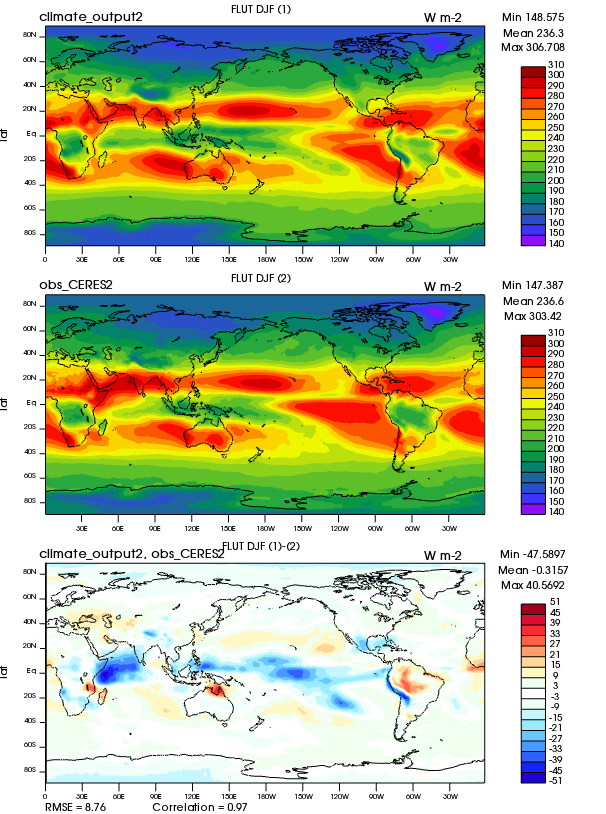
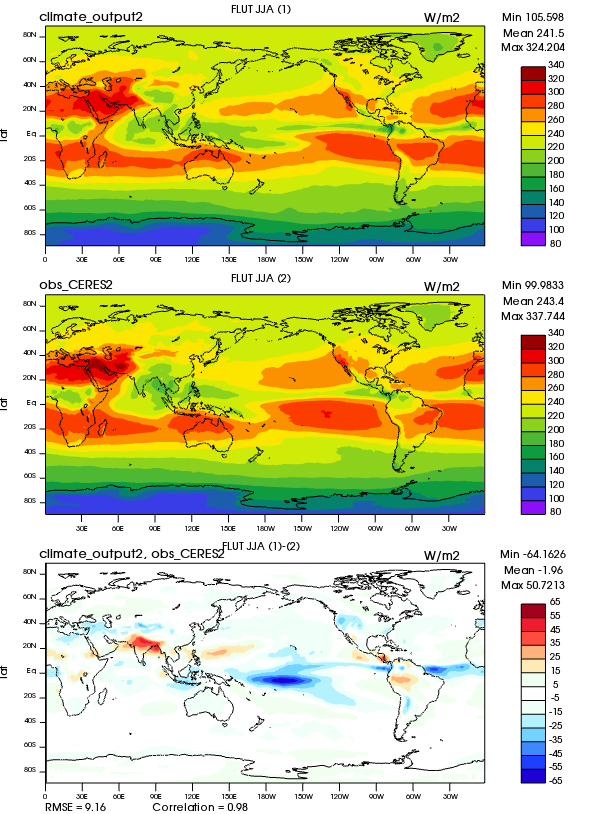
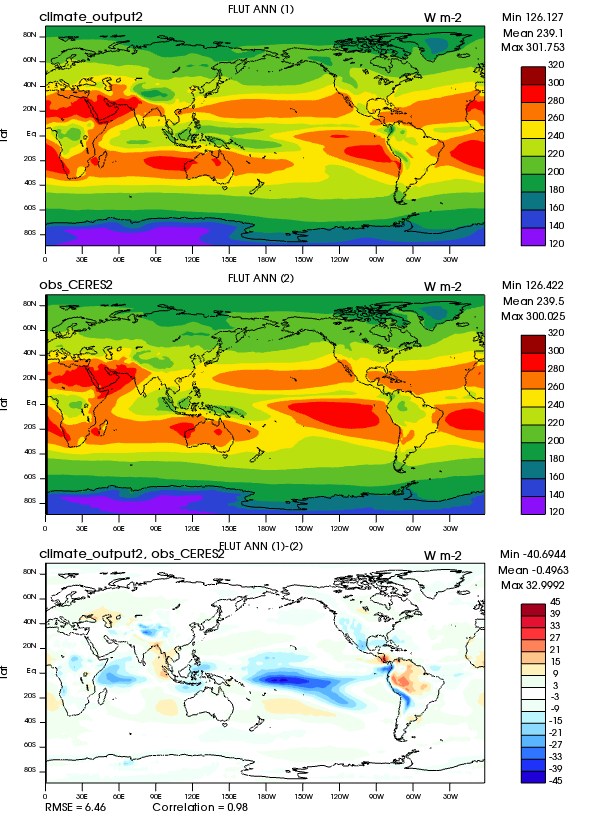
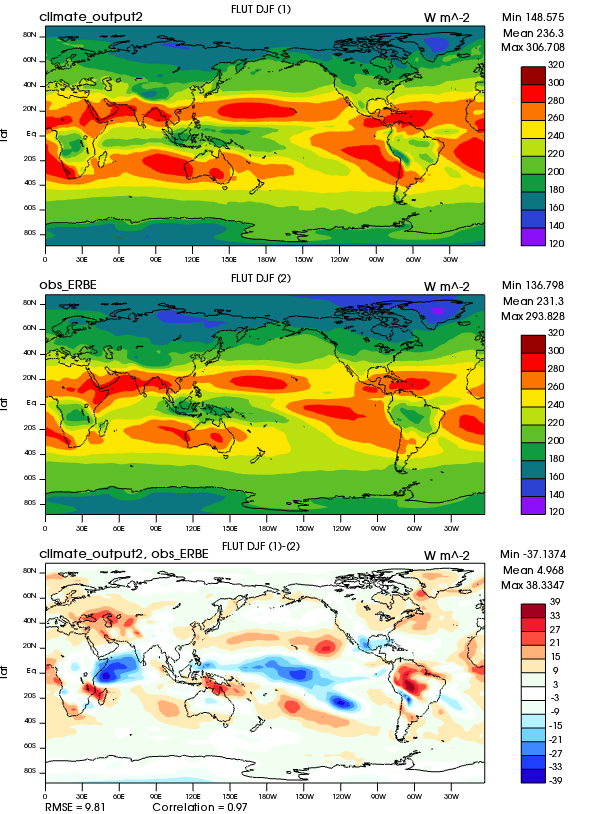
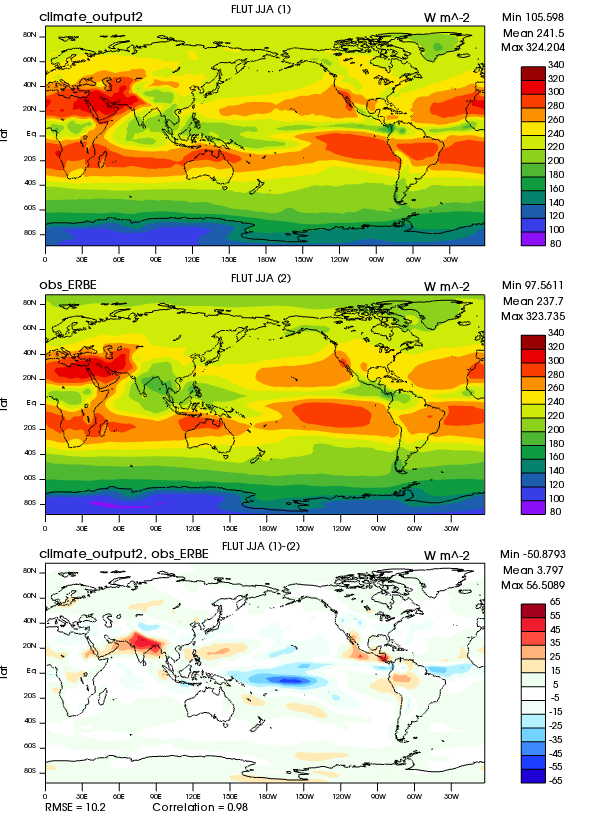
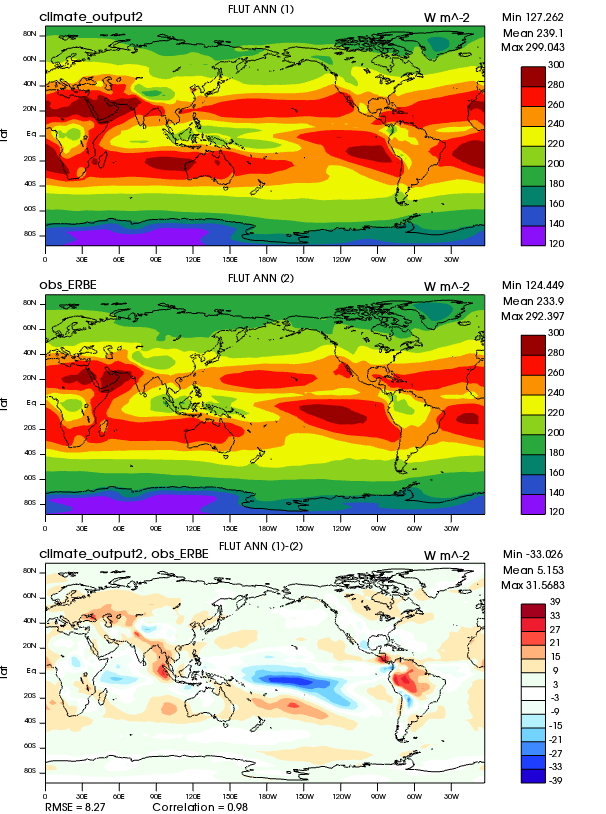
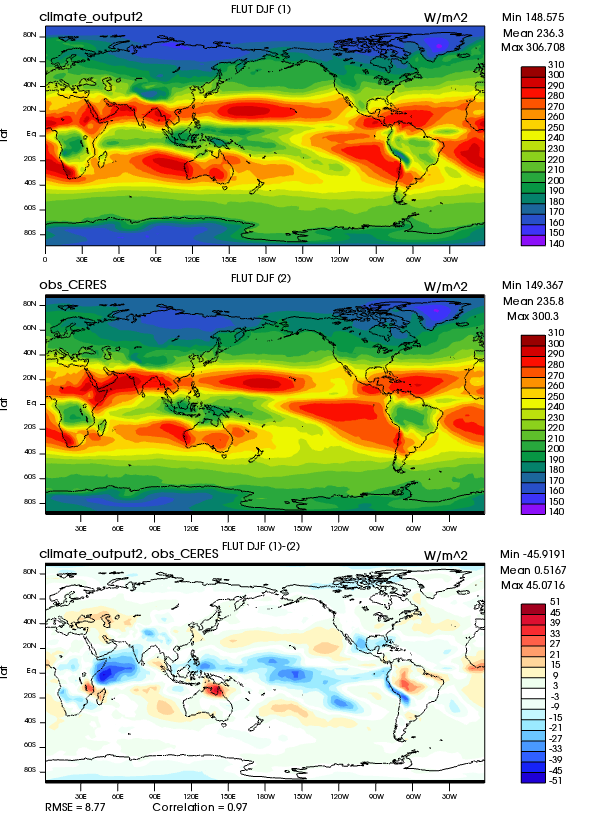
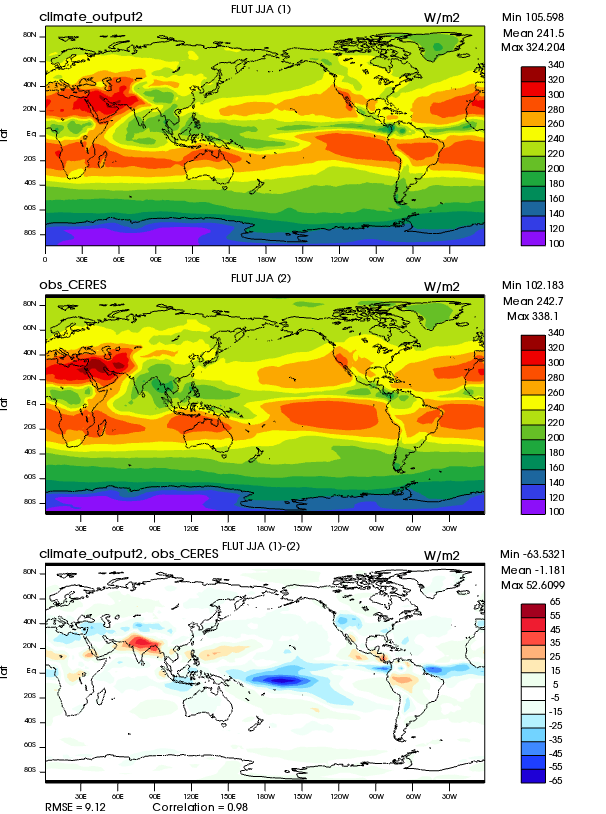
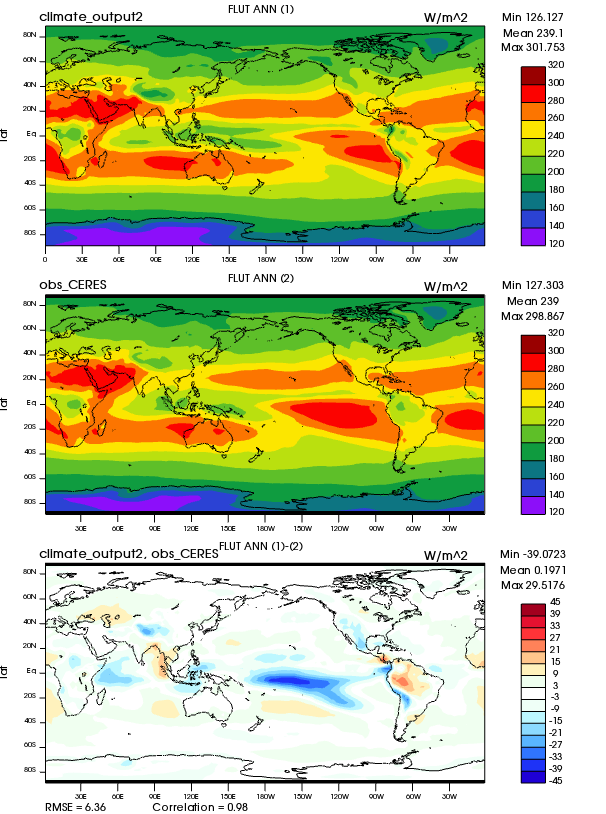
| FLUT | TOA upward LW flux (Northern) | Plot | Plot | Plot |
| ALBEDOC | TOA clearsky albedo | Plot | Plot | Plot |
| CLDMED | Mid cloud amount (IR clouds) (Northern) | Plot | Plot | Plot |
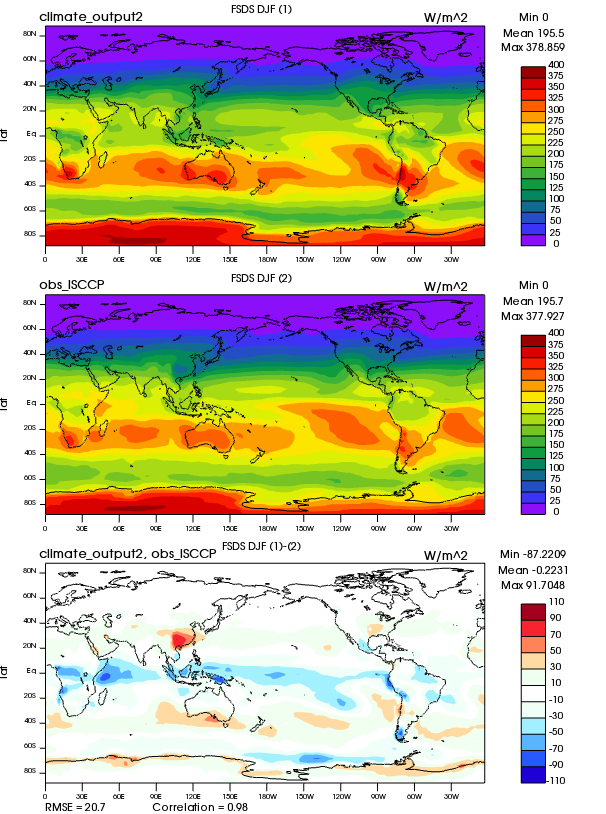
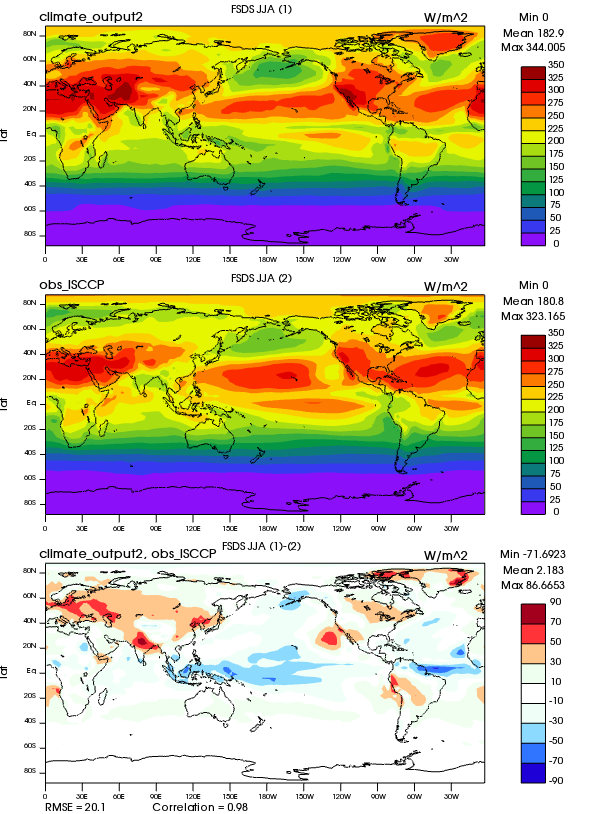
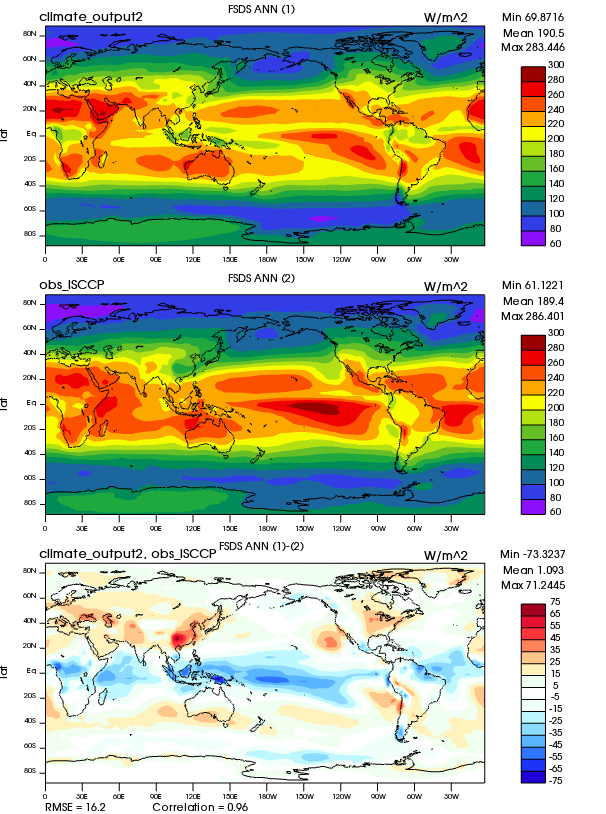
| FSDS | Surf SW downwelling flux (Northern) | Plot | Plot | Plot |
| CLDLOW | Low cloud amount (IR clouds) | Plot | Plot | Plot |
| MEANTAU | Mean cloud optical thickness (Day) | Plot | Plot | Plot |
| SWCFSRF | Surf SW Cloud Forcing | Plot | Plot | Plot |
| MEANTTOP | Mean cloud top temperature (Day) | Plot | Plot | Plot |
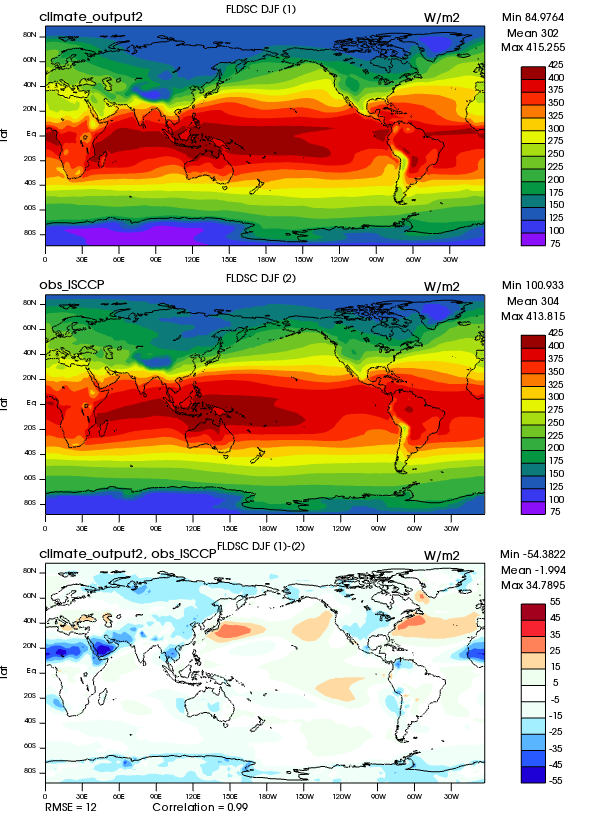
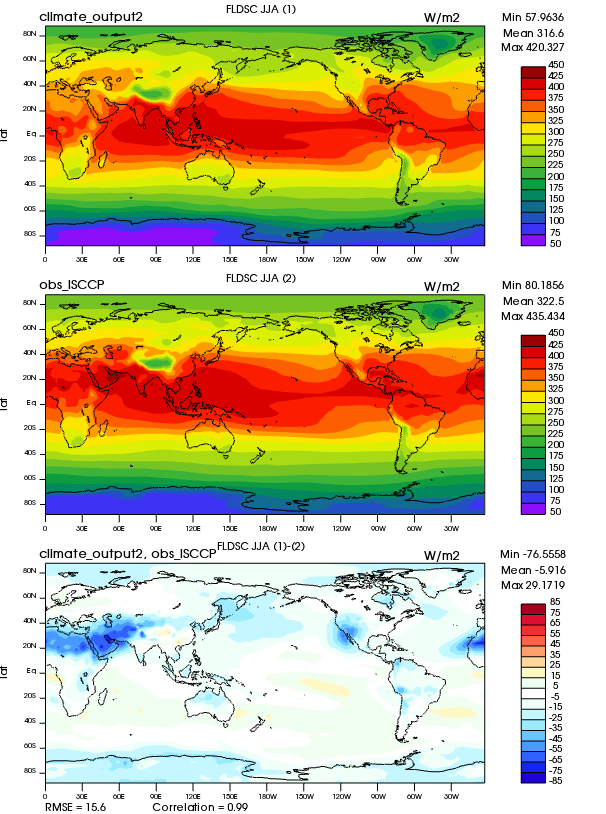
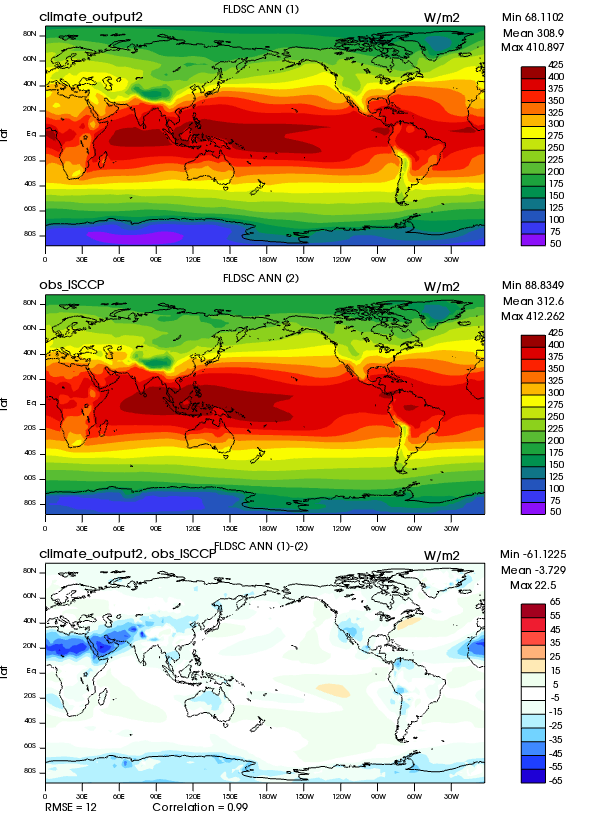
| FLDSC | Clearsky Surf LW downwelling flux | Plot | Plot | Plot |
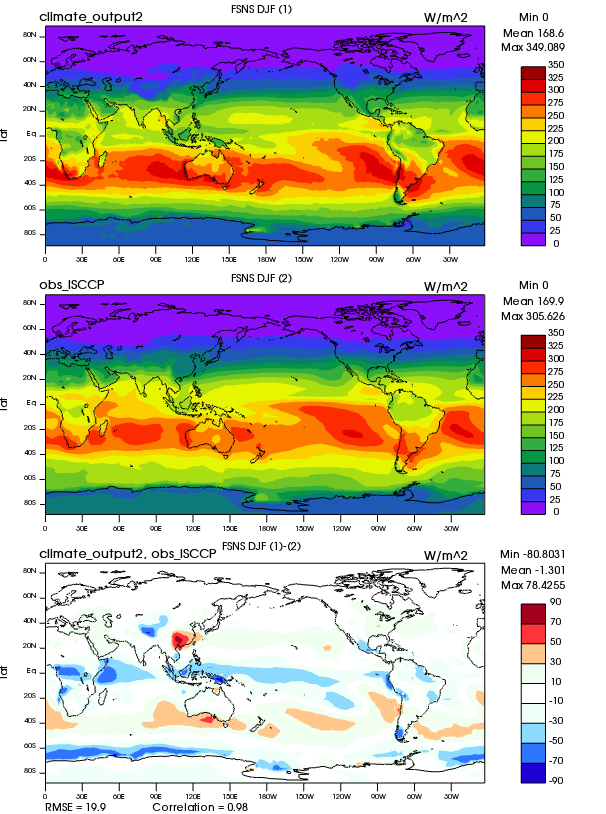
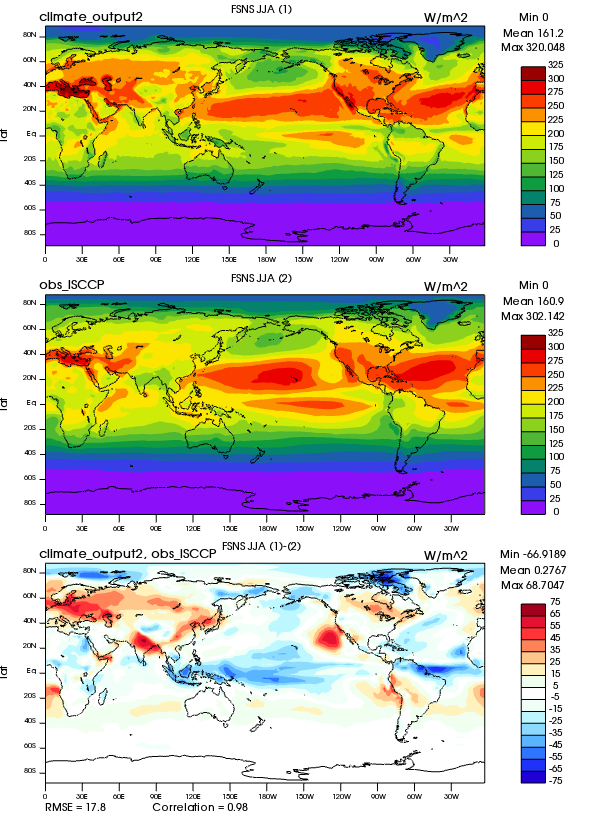
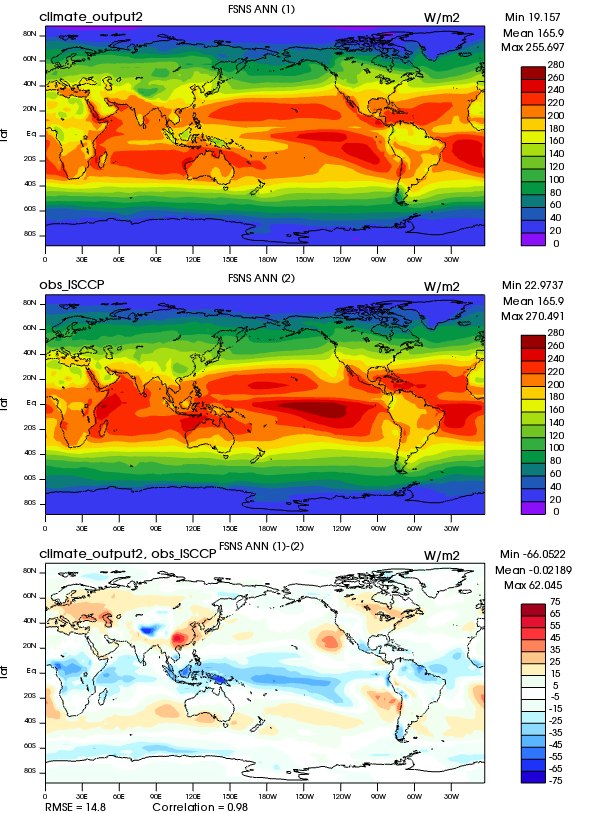
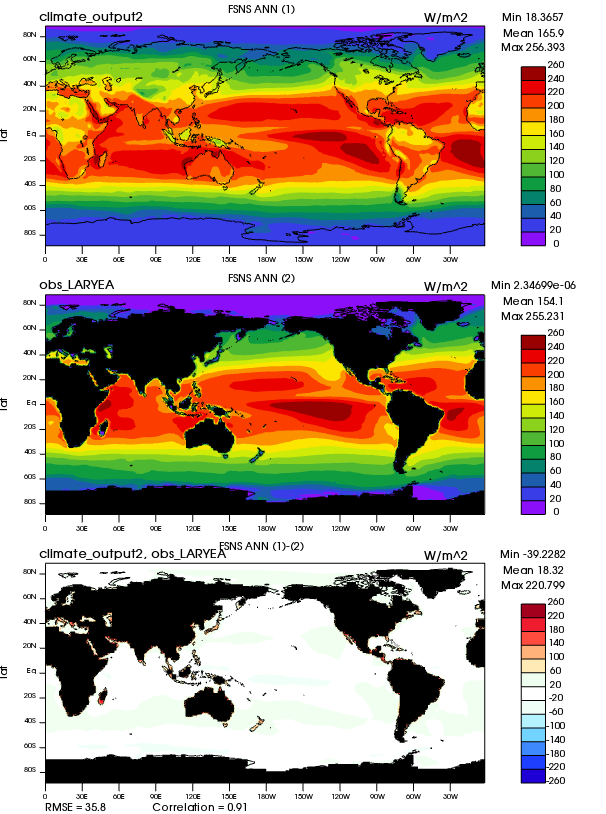
| FSNS | Surf Net SW flux (Northern) | Plot | Plot | Plot |
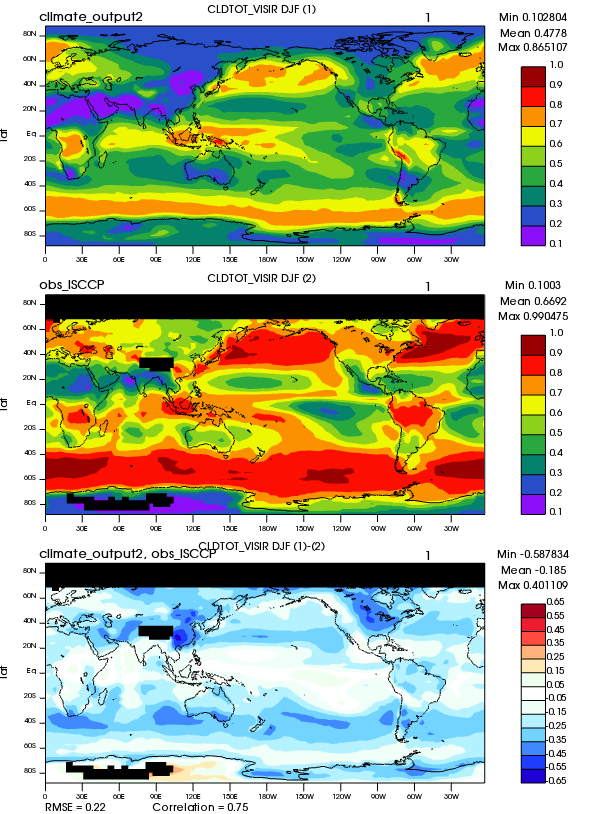
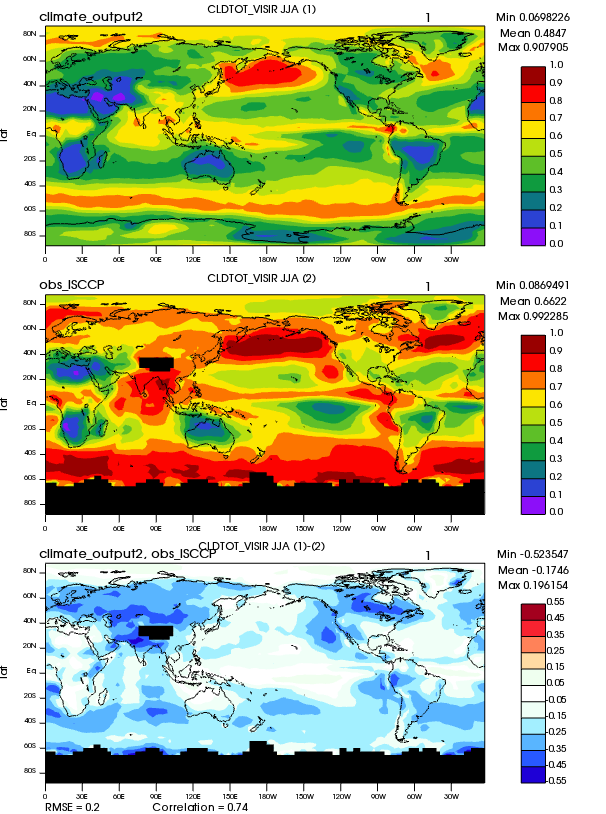
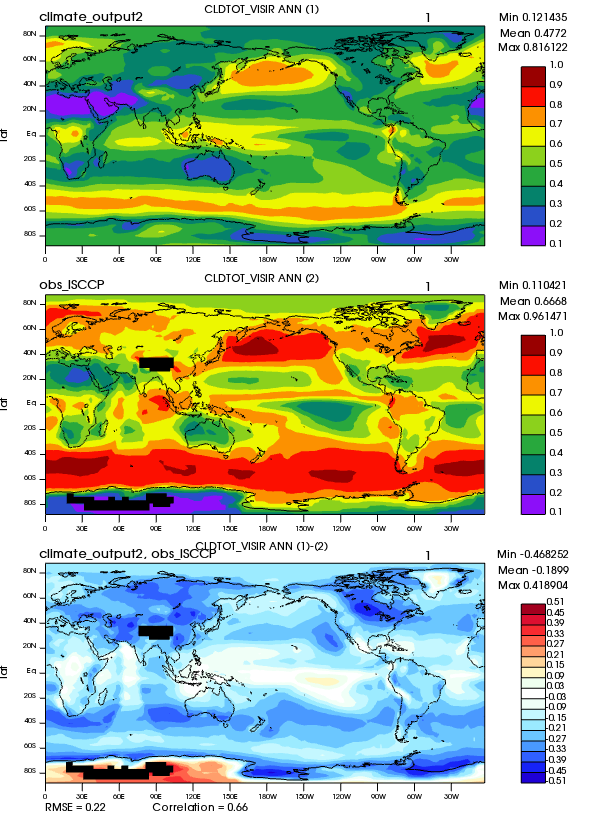
| CLDTOT_VISIR | Total cloud amount (VIS/IR/NIR clouds) | Plot | Plot | Plot |
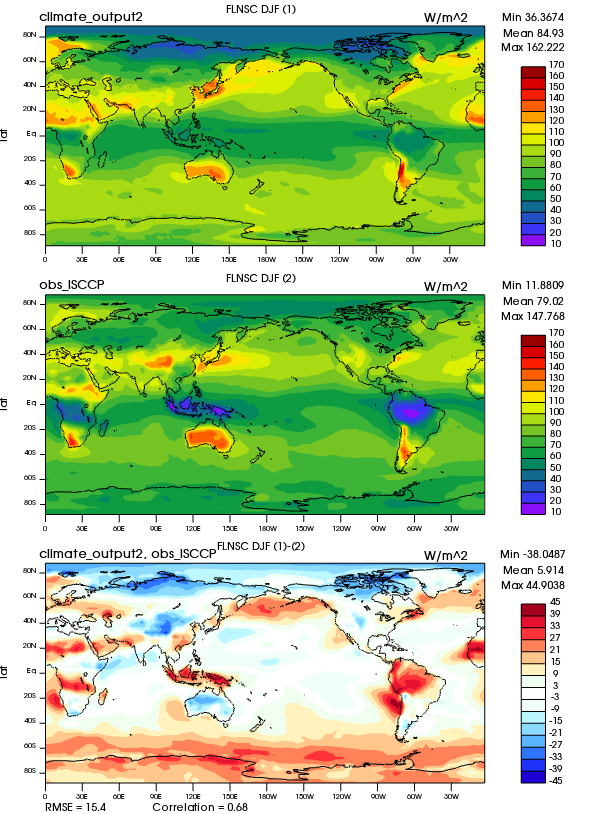
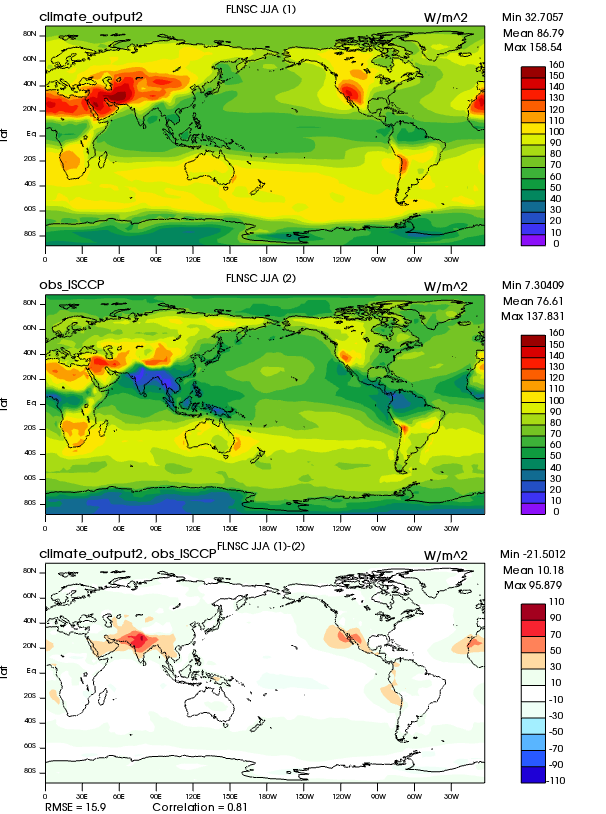
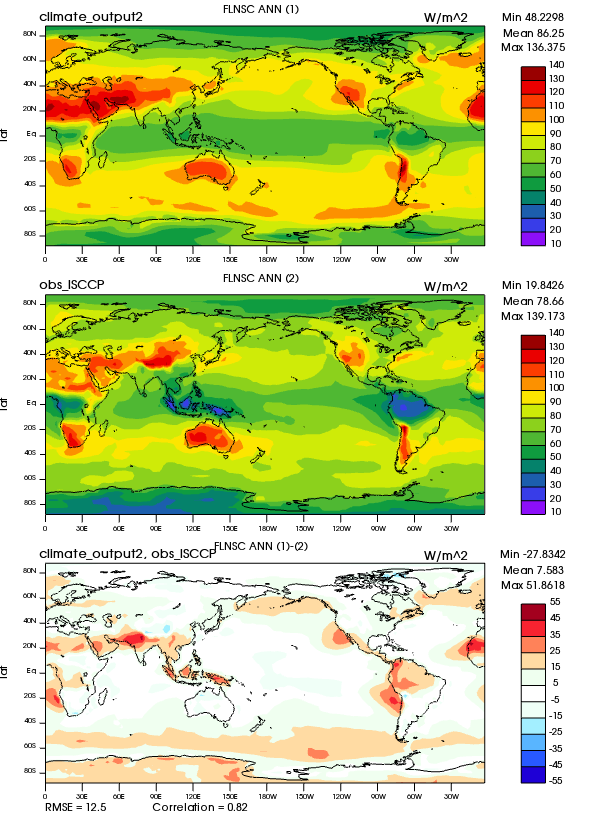
| FLNSC | Clearsky Surf Net LW flux (Northern) | Plot | Plot | Plot |
| CLDTOT | Mid cloud amount (IR clouds) | Plot | Plot | Plot |
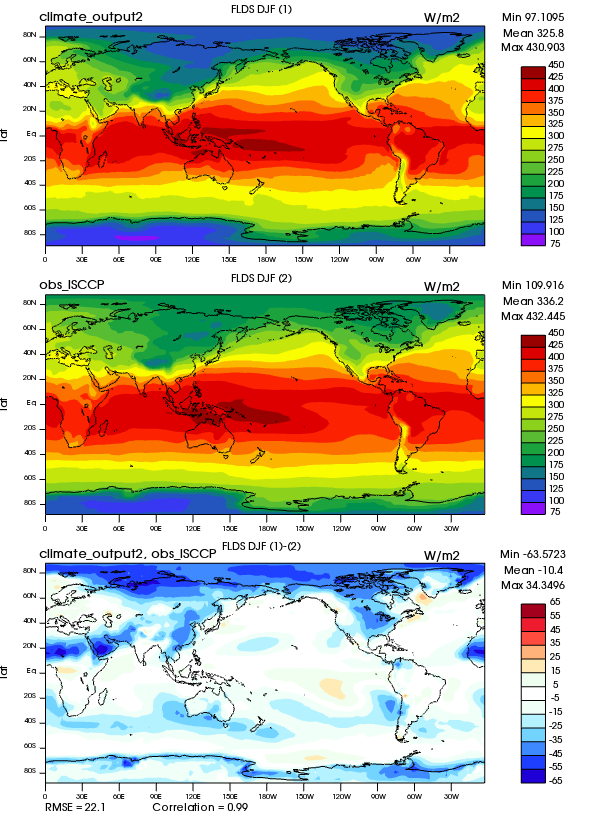
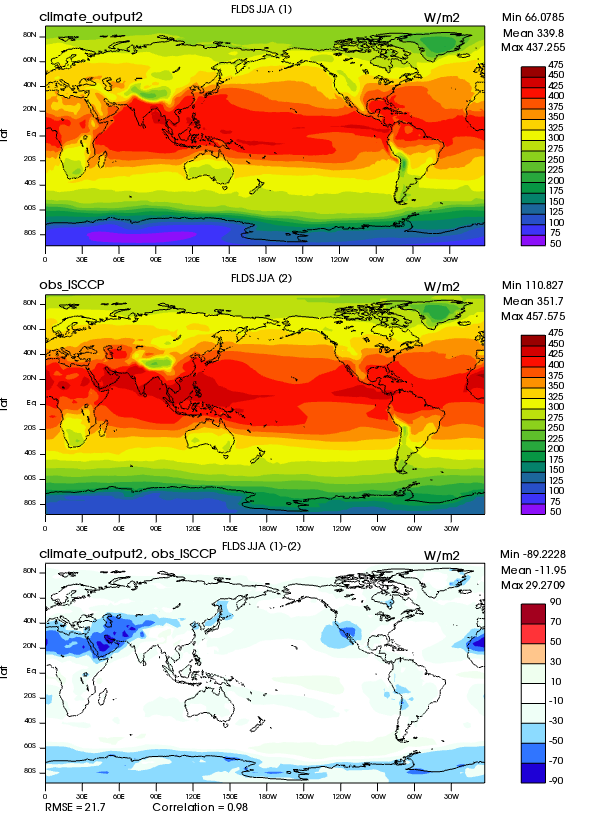
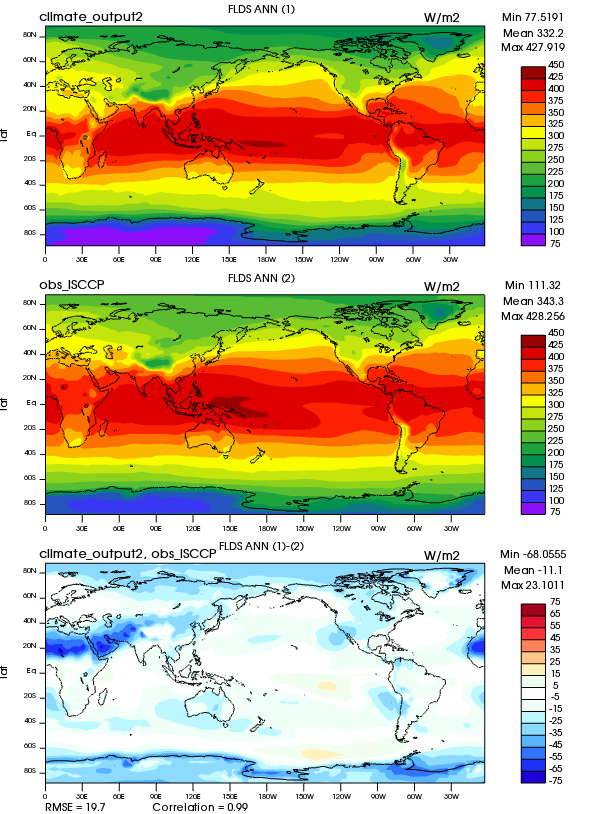
| FLDS | Surf LW downwelling flux | Plot | Plot | Plot |
| TCLDAREA | Total cloud area (Day) | Plot | Plot | Plot |
| LWCFSRF | Surf LW Cloud Forcing | Plot | Plot | Plot |
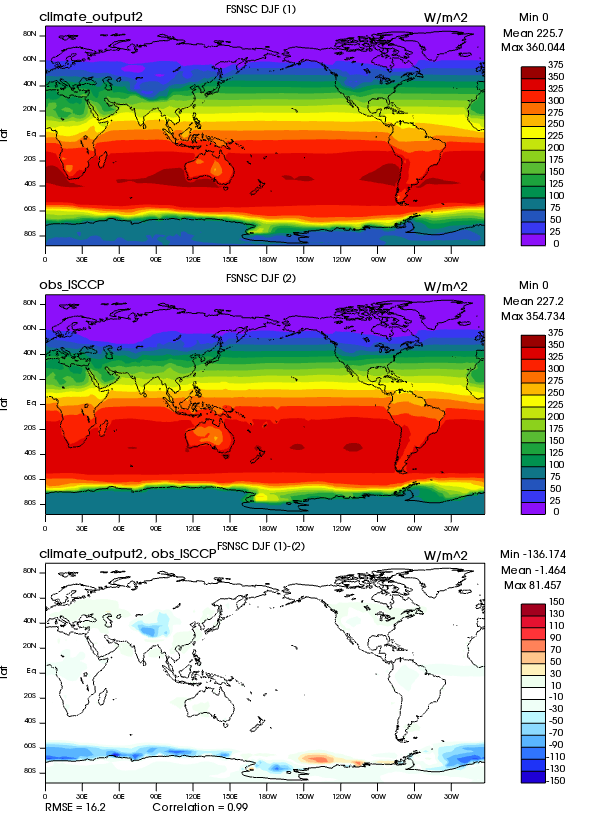
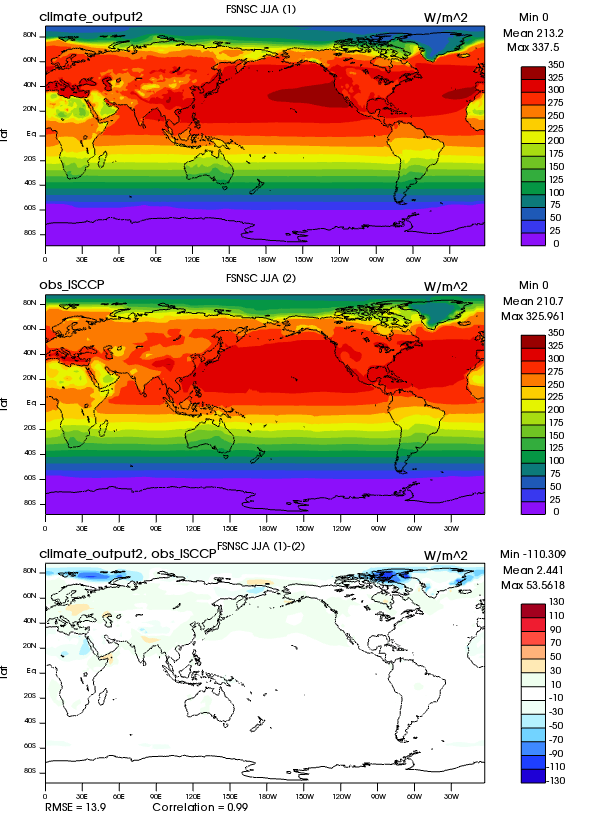
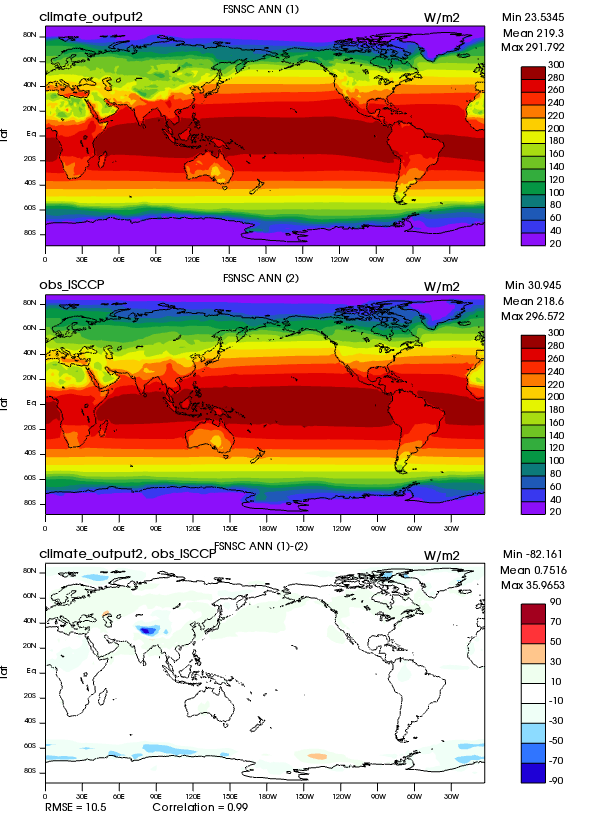
| FSNSC | Clearsky Surf Net SW Flux | Plot | Plot | Plot |
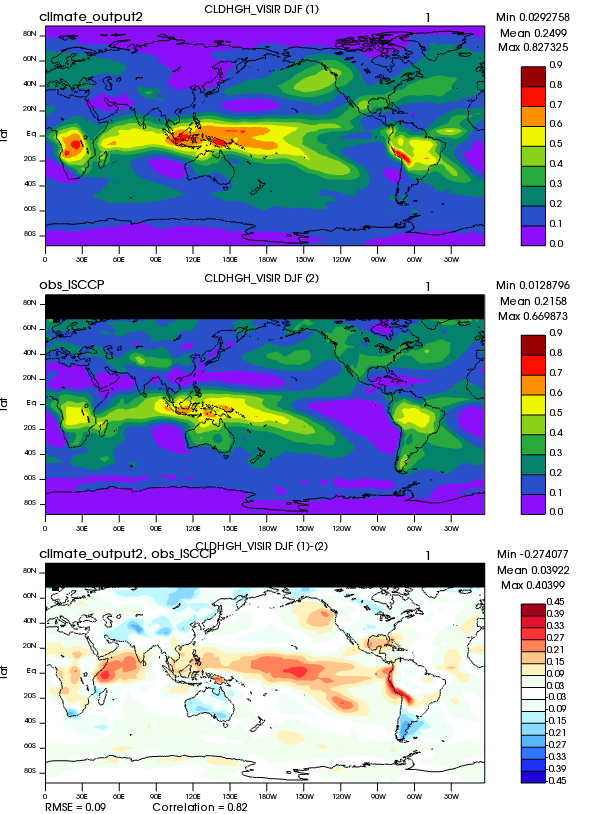
| CLDHGH_VISIR | High cloud amount (VIS/IR/NIR) clouds) (Northern) | Plot | Plot | Plot |
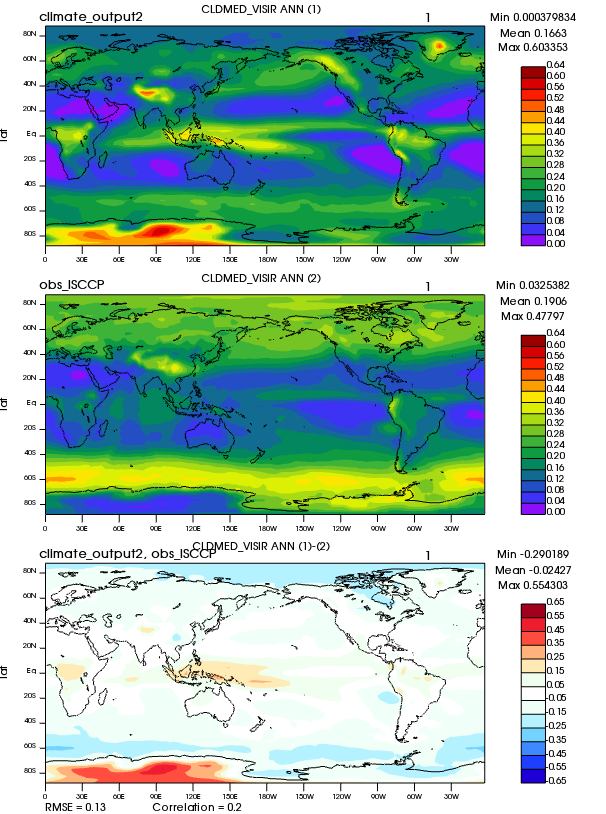
| CLDMED_VISIR | Mid cloud amount (VIS/IR/NIR clouds) | Plot | Plot | Plot |
| MEANPTOP | Mean cloud top pressure (Day) | Plot | Plot | Plot |
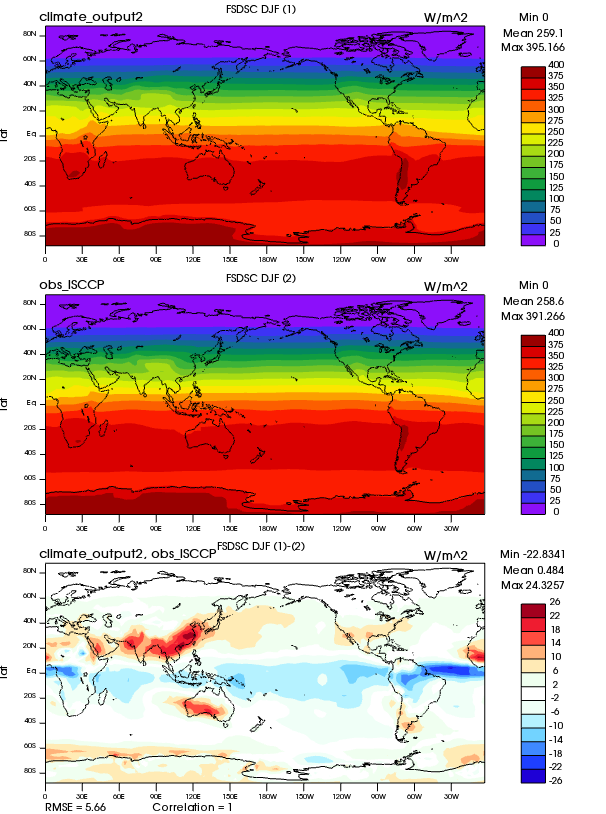
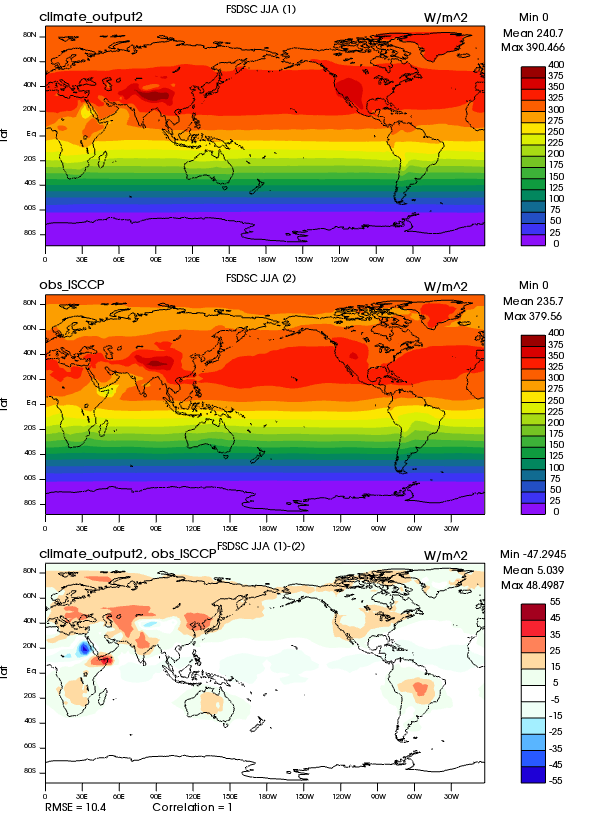
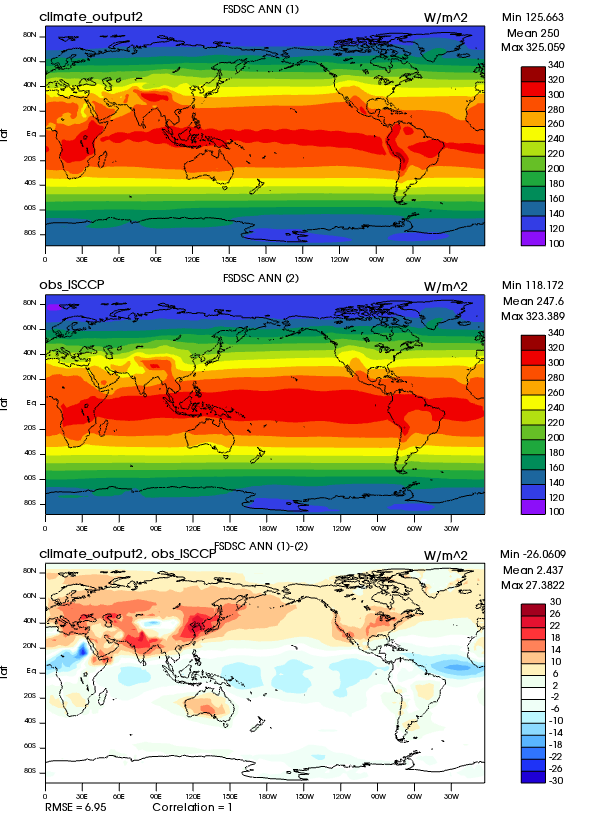
| FSDSC | Clearsky Surf SW downwelling flux (Northern) | Plot | Plot | Plot |
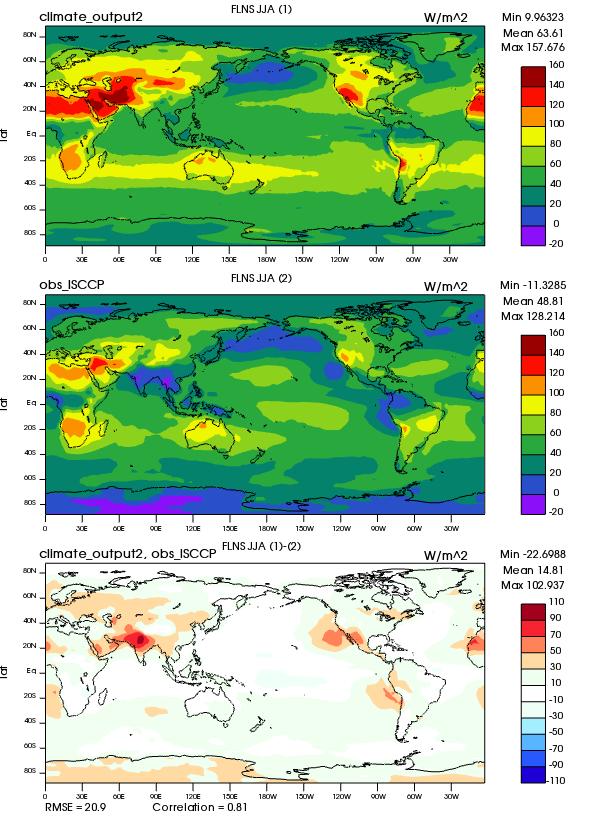
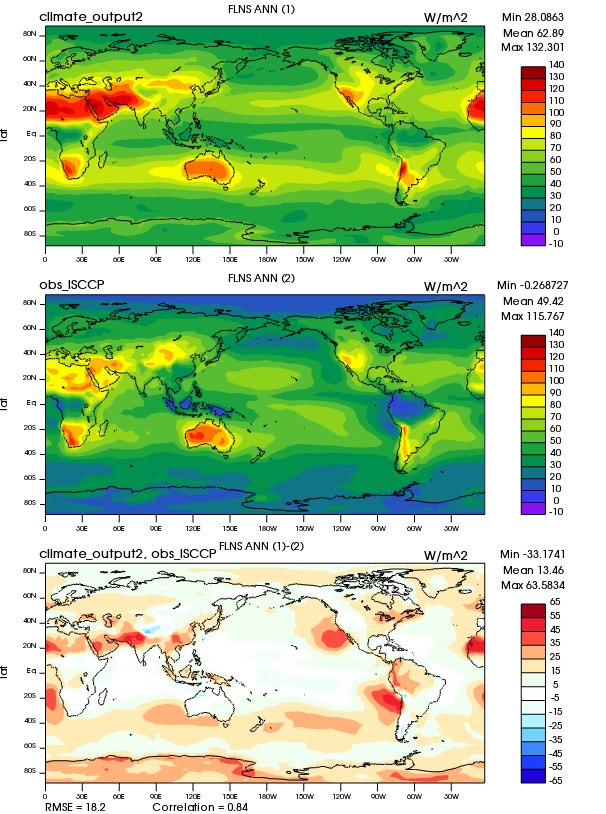
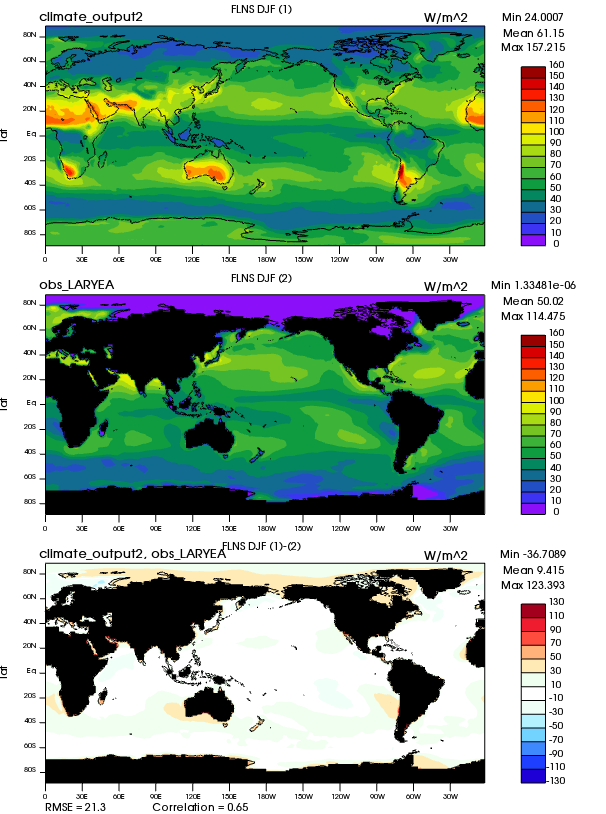
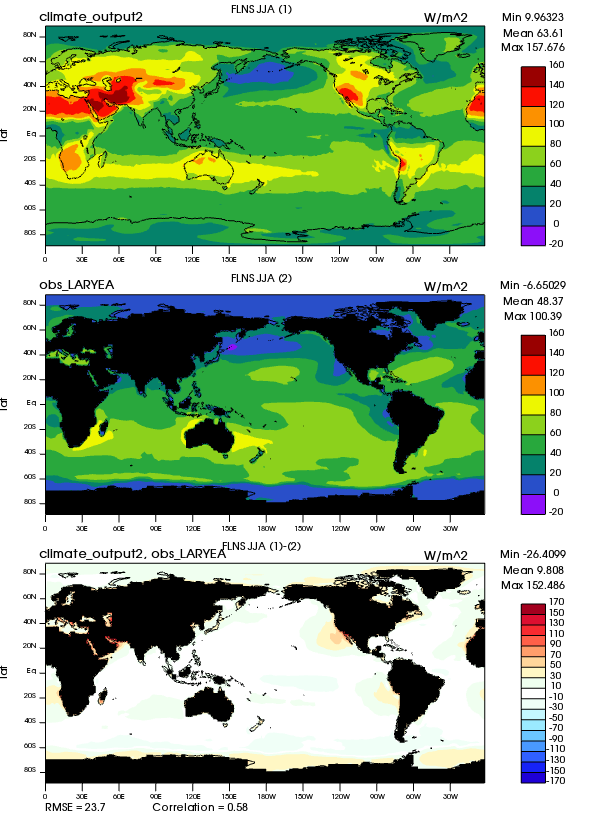
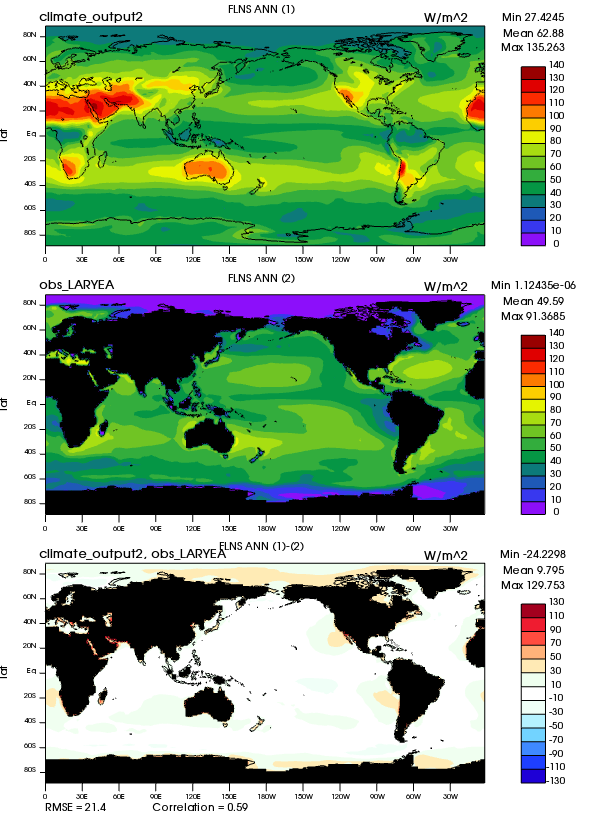
| FLNS | Surf Net LW flux (Northern) | Plot | Plot | Plot |
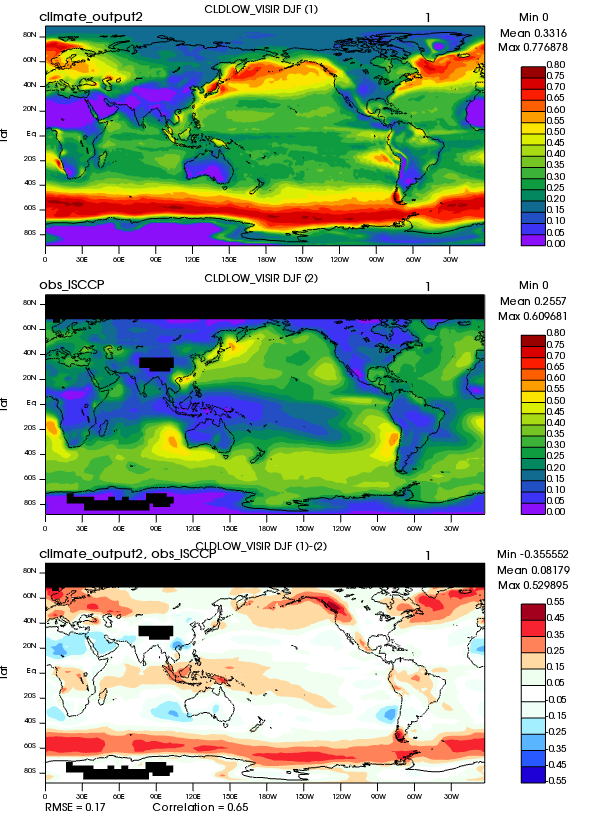
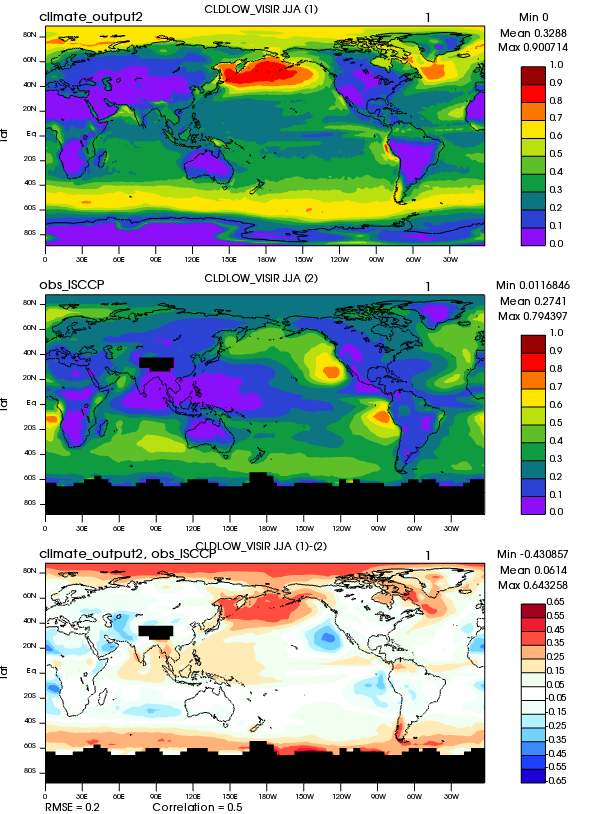
| CLDLOW_VISIR | Low cloud amount (VIS/IR/NIR) clouds) (Northern) | Plot | Plot | Plot |
| CLDHGH | High cloud amount (IR clouds) | Plot | Plot | Plot |
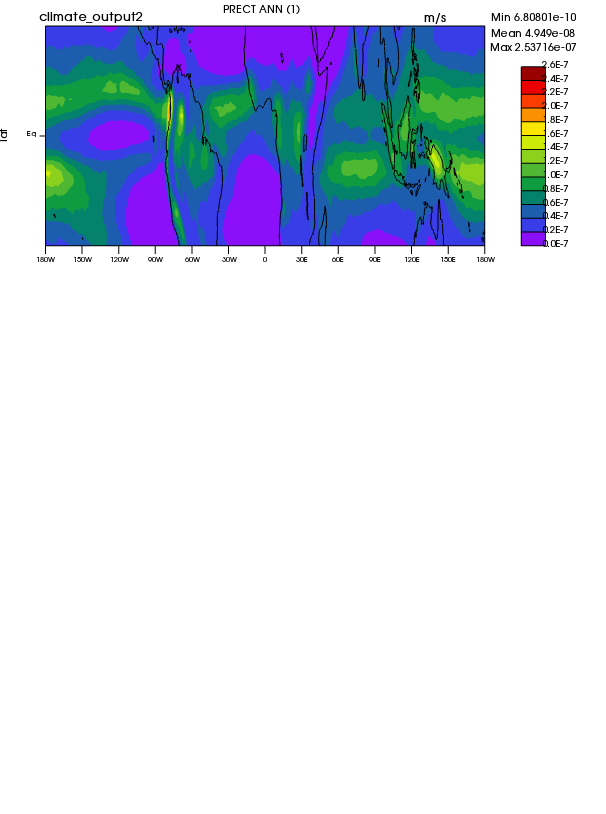
| PRECT | Precipitation rate | Plot | Plot | Plot |
| PRECT | Precipitation rate | Plot | Plot | Plot |
| PRECT | Precipitation rate | Plot | Plot | Plot |
| PRECT | Precipitation rate | Plot | Plot | Plot |
| FSNTOA | TOA net SW flux (Northern) | Plot | Plot | Plot |
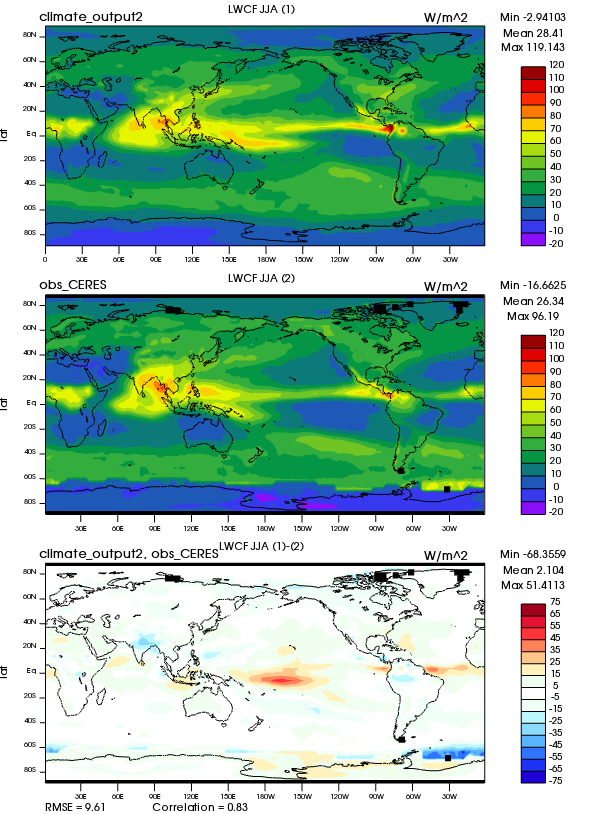
| LWCF | TOA longwave cloud forcing | Plot | Plot | Plot |
| FSNTOAC | TOA clearsky net SW flux (Northern) | Plot | Plot | Plot |
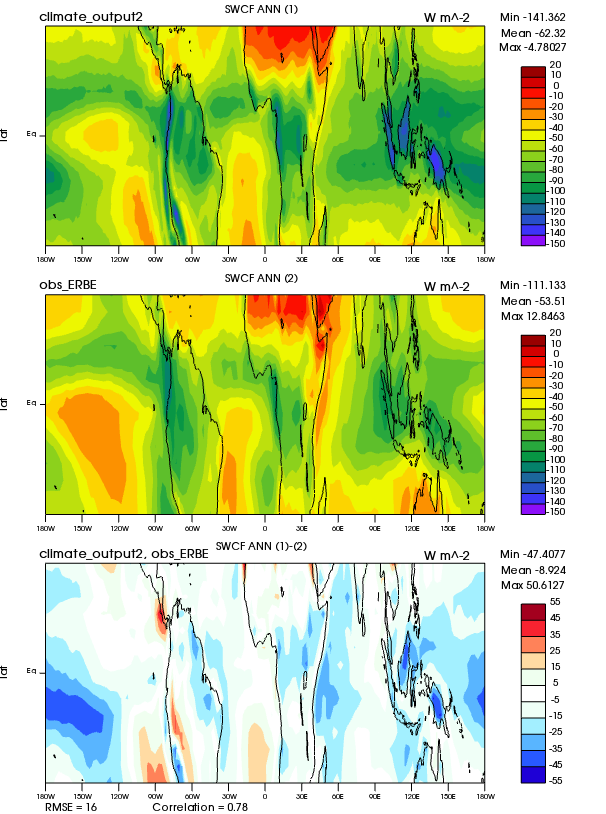
| SWCF | TOA shortwave cloud forcing | Plot | Plot | Plot |
| SWCF | TOA shortwave cloud forcing | Plot | Plot | Plot |
| FLUTC | TOA clearsky upward LW flux (Northern) | Plot | Plot | Plot |
| FLUT | TOA upward LW flux (Northern) | Plot | Plot | Plot |
| TREFHT | 2-meter air temperature (land) | Plot | Plot | Plot |
| PRECT | Precipitation rate | Plot | Plot | Plot |
| PRECT | Precipitation rate | Plot | Plot | Plot |
| T | Temperature | Plot | Plot | Plot |
| T | Temperature | Plot | Plot | Plot |
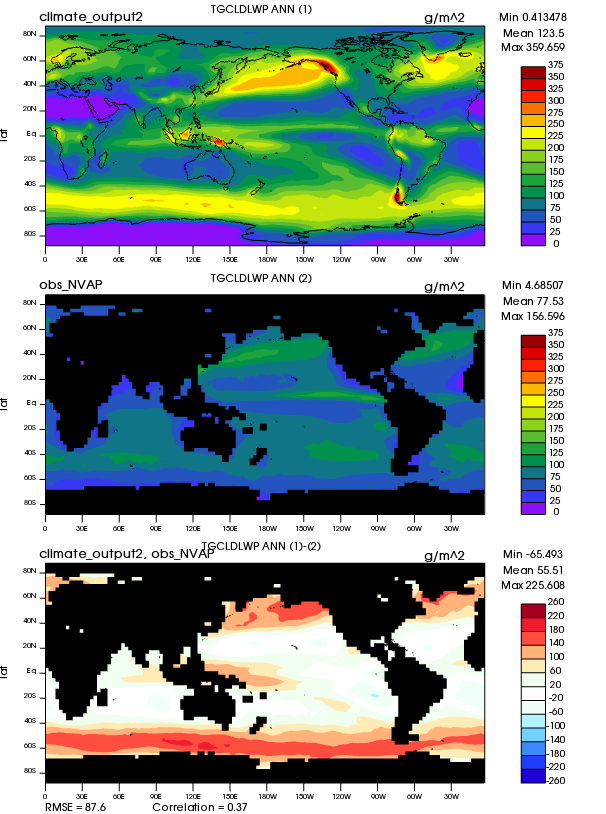
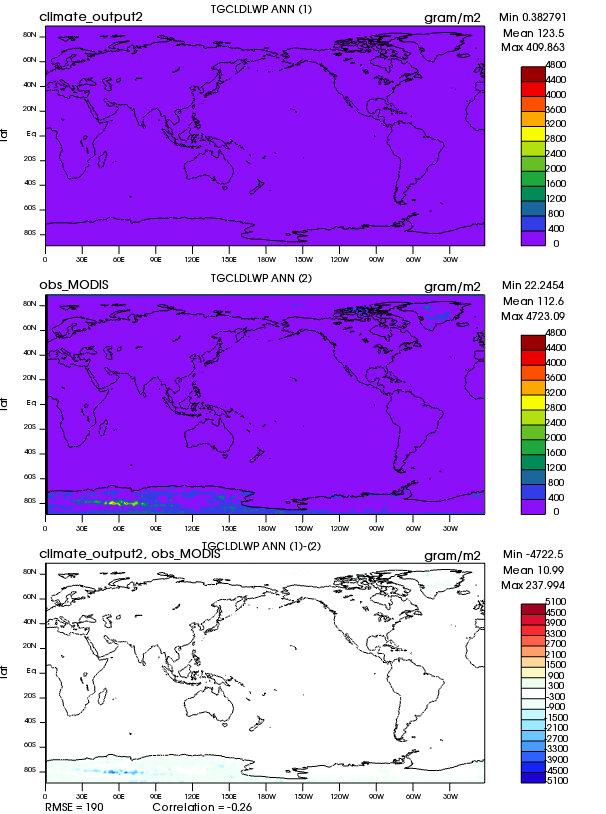
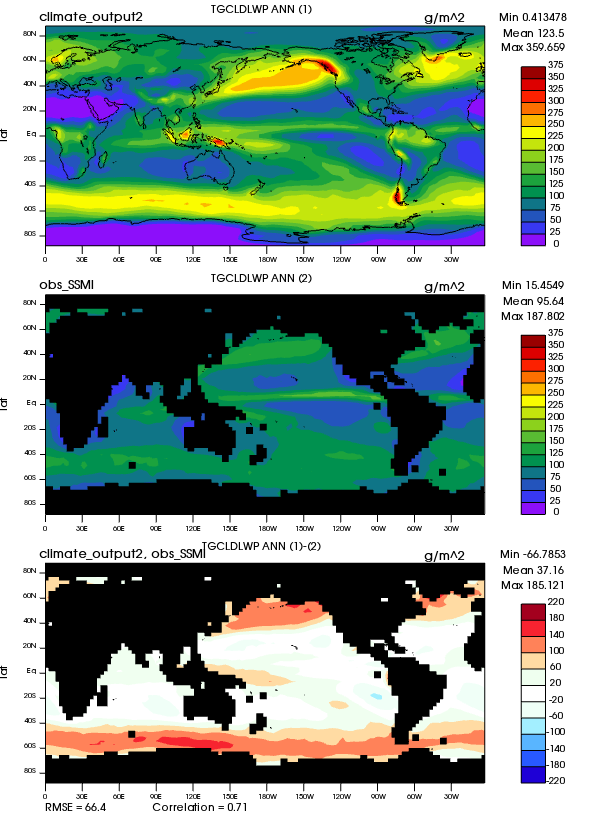
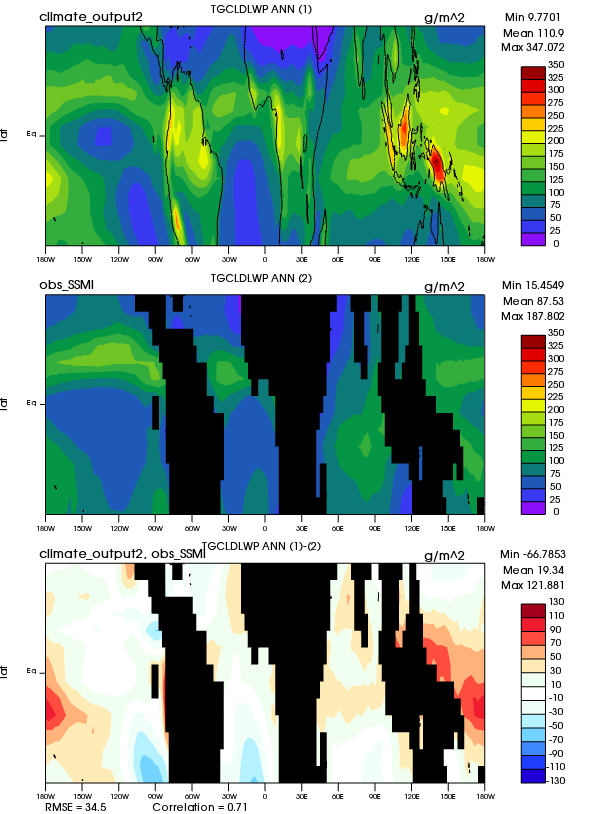
| TGCLDLWP | Cloud liquid water | Plot | Plot | Plot |
| TGCLDLWP | Cloud liquid water | Plot | Plot | Plot |
| PREH2O | Total precipitable water | Plot | Plot | Plot |
| PREH2O | Total precipitable water | Plot | Plot | Plot |
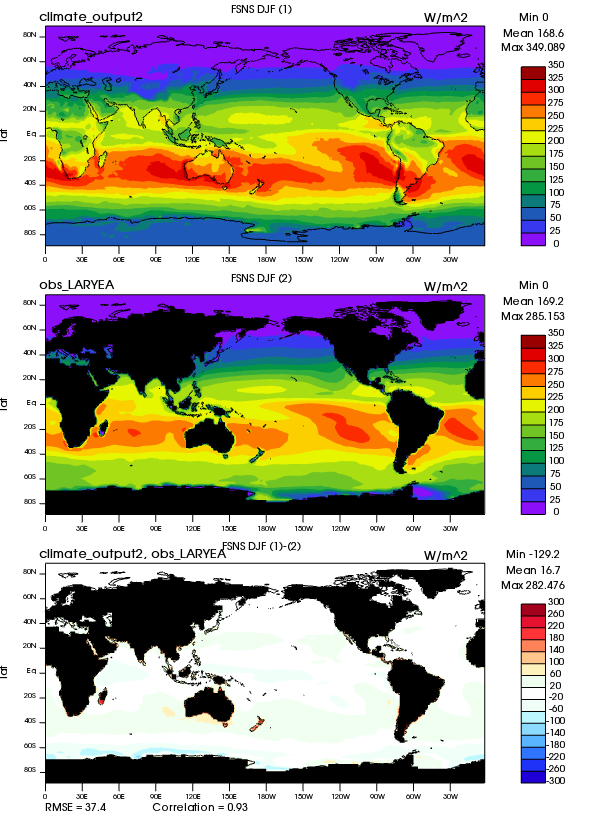
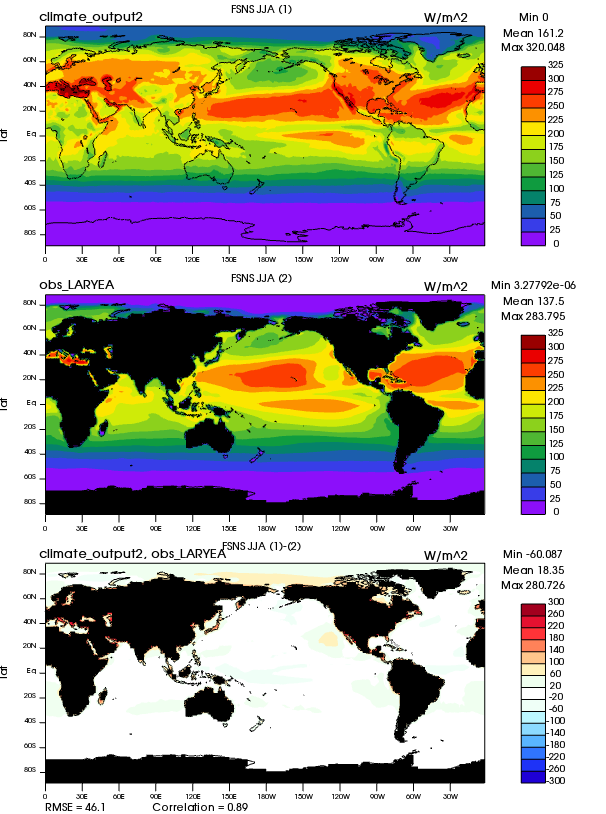
| FSNS | Surf Net SW flux (Northern) | Plot | Plot | Plot |
| SHFLX | Surface sensible heat flux | Plot | Plot | Plot |
| QFLX | Surface water flux (Northern) | Plot | Plot | Plot |
| FLNS | Surf Net LW flux (Northern) | Plot | Plot | Plot |
| PRECT_LAND | Precipitation rate (land) | Plot | Plot | Plot |
| MEANTAU | Mean cloud optical thickness (Day) | Plot | Plot | Plot |
| MEANTTOP | Mean cloud top temperature (Day) | Plot | Plot | Plot |
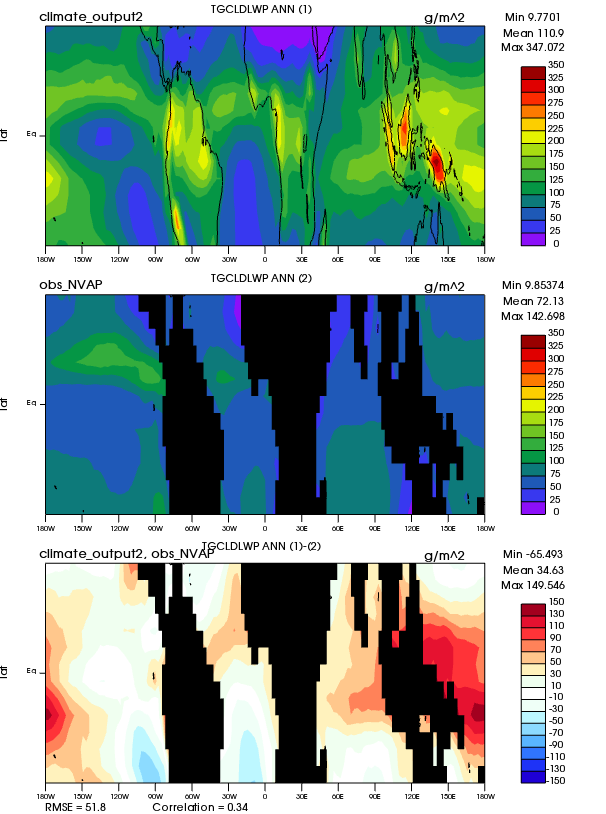
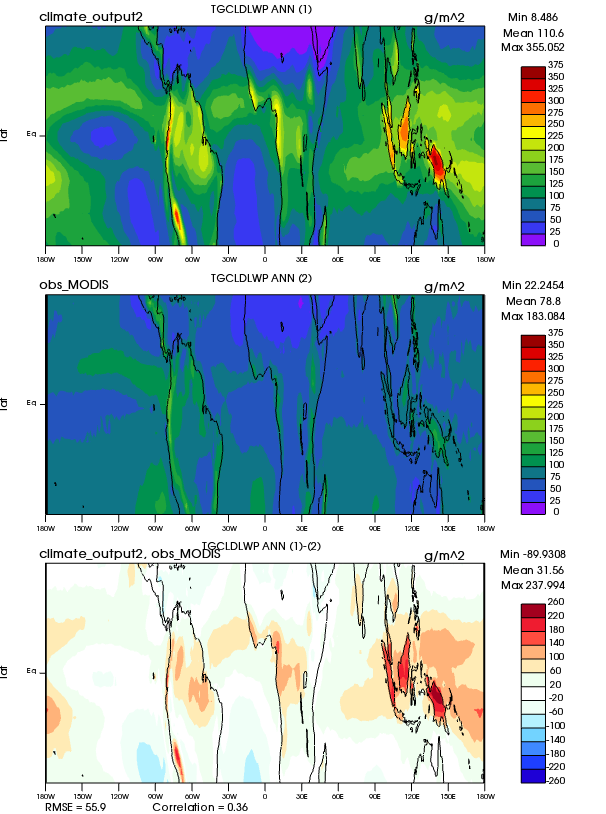
| TGCLDLWP | Cloud liquid water | Plot | Plot | Plot |
| TGCLDLWP | Cloud liquid water | Plot | Plot | Plot |
| TCLDAREA | Total cloud area (Day) | Plot | Plot | Plot |
| MEANPTOP | Mean cloud top pressure (Day) | Plot | Plot | Plot |
| PREH2O | Total precipitable water | Plot | Plot | Plot |
| PREH2O | Total precipitable water | Plot | Plot | Plot |
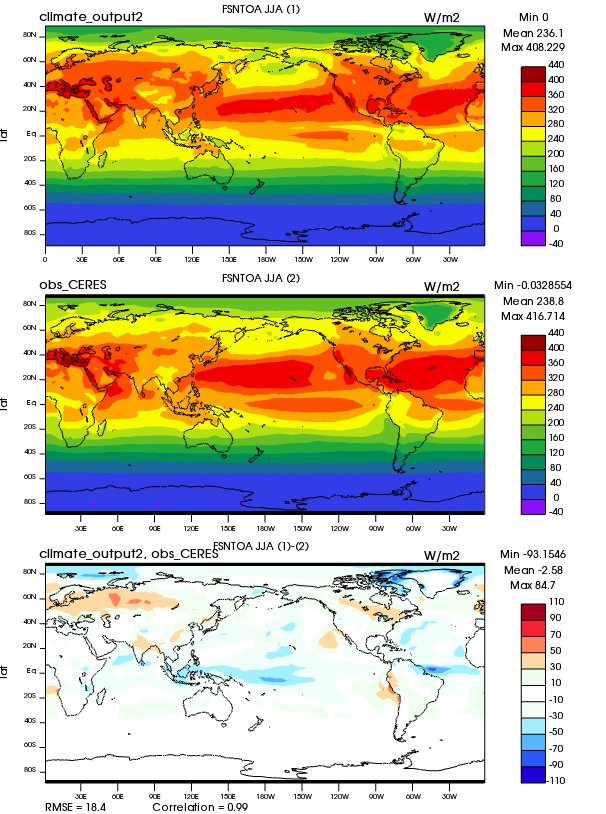
| FSNTOA | TOA net SW flux (Northern) | Plot | Plot | Plot |
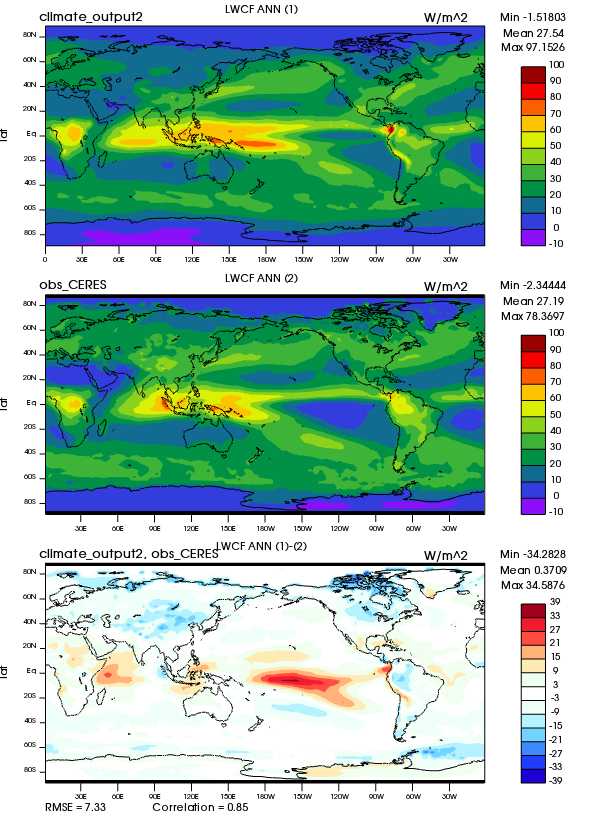
| LWCF | TOA longwave cloud forcing | Plot | Plot | Plot |
| FSNTOAC | TOA clearsky net SW flux (Northern) | Plot | Plot | Plot |
| SWCF | TOA shortwave cloud forcing | Plot | Plot | Plot |
| SWCF | TOA shortwave cloud forcing | Plot | Plot | Plot |
| ALBEDO | TOA albedo (Northern) | Plot | Plot | Plot |
| FLUTC | TOA clearsky upward LW flux (Northern) | Plot | Plot | Plot |
| FLUT | TOA upward LW flux (Northern) | Plot | Plot | Plot |
| ALBEDOC | TOA clearsky albedo | Plot | Plot | Plot |
| TREFHT | 2-meter air temperature (land) | Plot | Plot | Plot |
| PRECIP | Cumulative precipitation (land) | Plot | Plot | Plot |
| SST | Sea surface temperature | Plot | Plot | Plot |
| SST | Sea surface temperature | Plot | Plot | Plot |
| TGCLDLWP | Cloud liquid water | Plot | Plot | Plot |
| TGCLDLWP | Cloud liquid water | Plot | Plot | Plot |
| PRECT | Precipitation rate | Plot | Plot | Plot |
| PRECT | Precipitation rate | Plot | Plot | Plot |
| PREH2O | Total precipitable water | Plot | Plot | Plot |
| PREH2O | Total precipitable water | Plot | Plot | Plot |
| TTRP | Tropopause temperature | Plot | Plot | Plot |
| Z3 | Geopotential height (Northern) | Plot | Plot | Plot |
| Z3 | Geopotential height (Northern) | Plot | Plot | Plot |
| LHFLX | Surface latent heat flux | Plot | Plot | Plot |
| T | Temperature | Plot | Plot | Plot |
| T | Temperature | Plot | Plot | Plot |
| EP | Evaporation - precipitation | Plot | Plot | Plot |
| QFLX | Surface water flux (Northern) | Plot | Plot | Plot |
| U | Zonal Wind | Plot | Plot | Plot |
| PREH2O | Total precipitable water | Plot | Plot | Plot |
| PREH2O | Total precipitable water | Plot | Plot | Plot |
 AMWG 05/03/16 08:32:02 and OBS Data