| topten | Tier 1A Diagnostics |
| 1 | Tables of ANN, DJF, JJA, global and regional means and RMSE. |
| 2 | Line plots of annual implied northward transports. |
| 3 | Line plots of DJF, JJA and ANN zonal means |
| 4 | Vertical contour plots of DJF, JJA and ANN zonal means |
| 4a | Vertical (XZ) contour plots of DJF, JJA and ANN meridional means |
| 5 | Horizontal contour plots of DJF, JJA and ANN means |
| 6 | Horizontal vector plots of DJF, JJA and ANN means |
| 7 | Polar contour and vector plots of DJF, JJA and ANN means |
| 8 | Annual cycle contour plots of zonal means |
| 9 | Horizontal contour plots of DJF-JJA differences |
| 10 | Annual cycle line plots of global means |
| 11 | Pacific annual cycle, Scatter plot plots |
| 12 | Vertical profile plots from 17 selected stations |
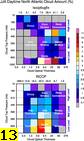
| 13 | ISCCP cloud simulator plots |
| 14 | Taylor Diagram plots |
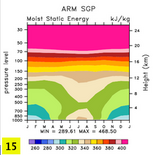
| 15 | Annual Cycle at Select Stations plots |
| tier1b_clouds | Tier 1B COSP Cloud Diagnostics (Global) |
| tier1b_prect | Tier1b External Diagnostics - Precipitation |
| tier1b_so | Tier 1B Diagnostics (Southern Ocean) |
| tier1b_wind | Tier1b External Diagnostics - Wind |