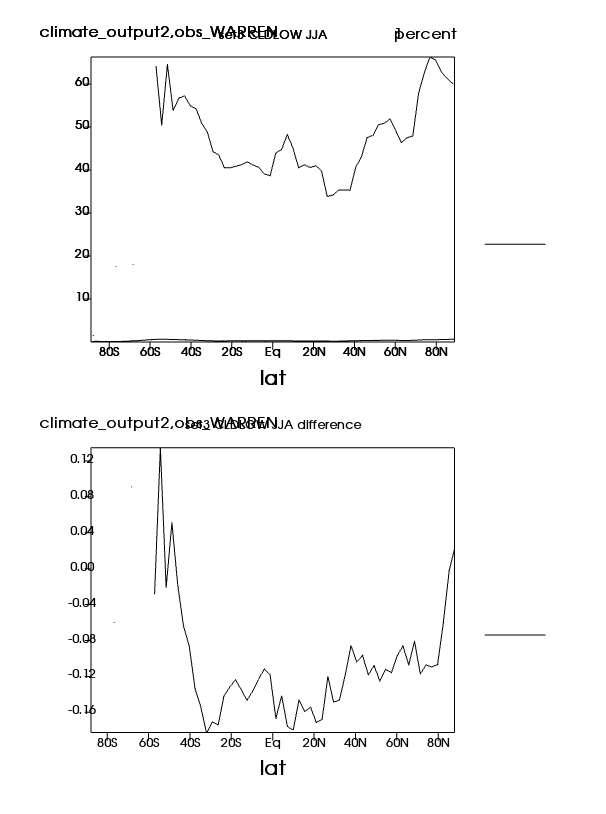
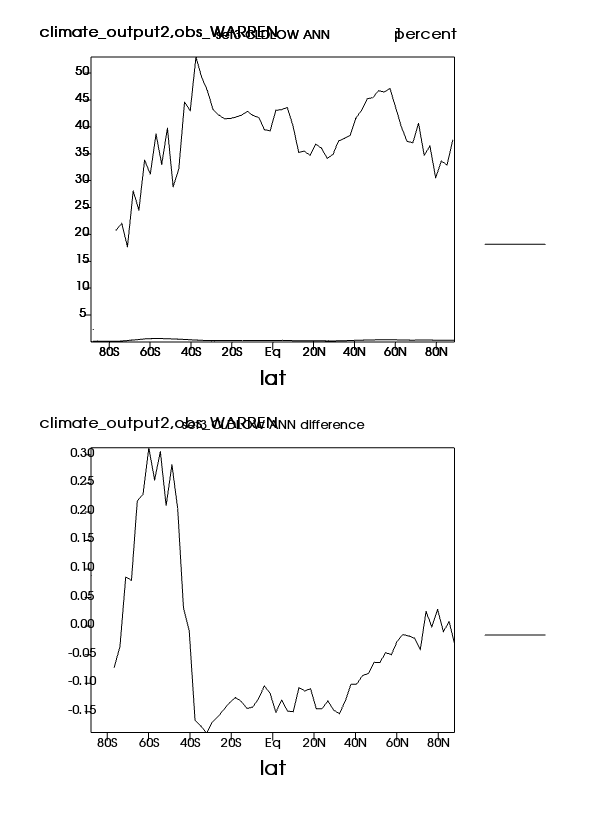
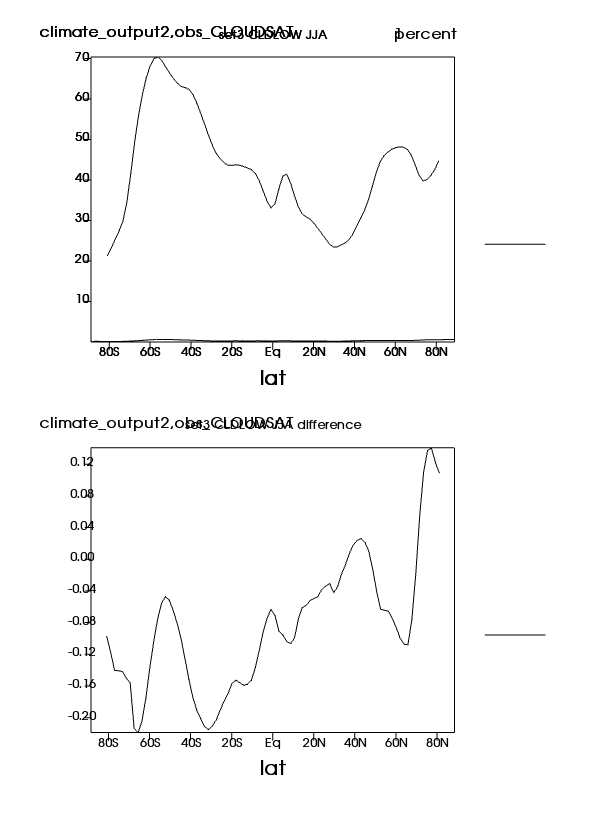
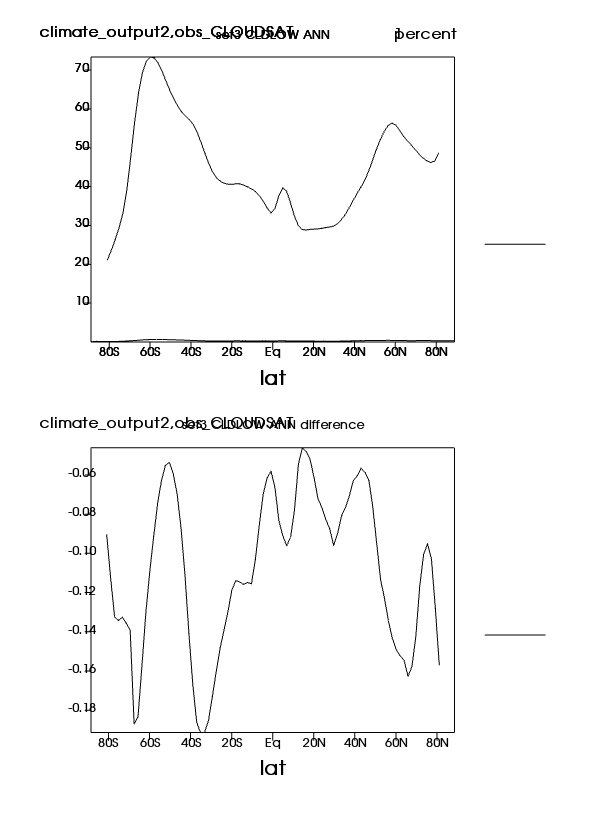
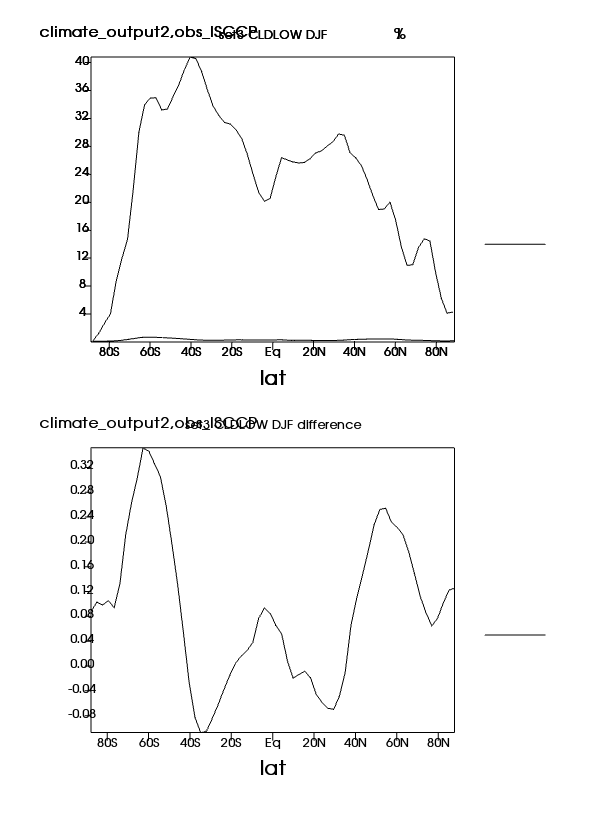
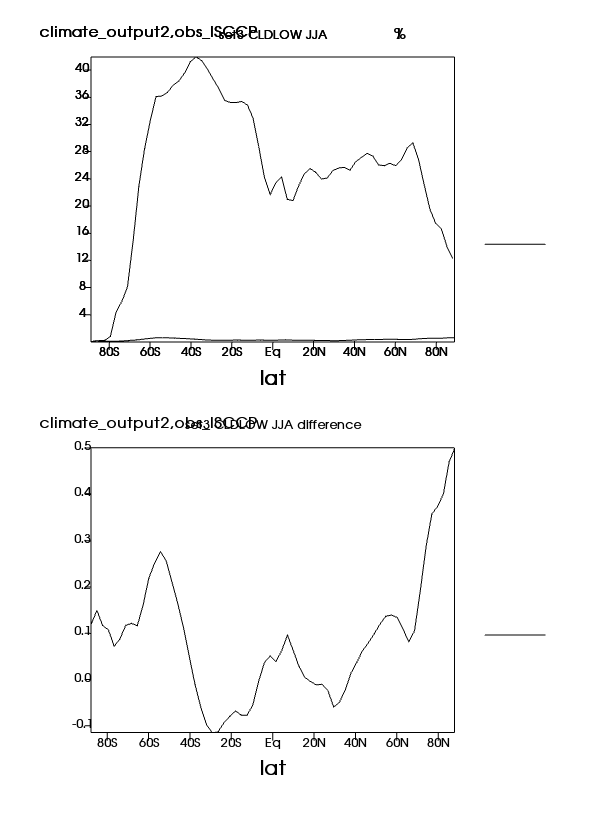
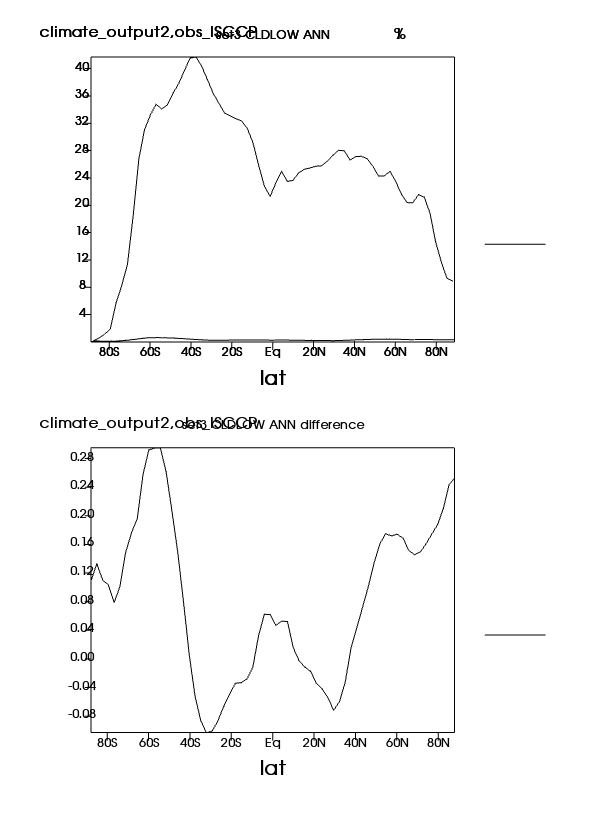
| CLDLOW | Low cloud amount (IR clouds) | Plot | Plot | Plot |
| CLDTOT | Mid cloud amount (IR clouds) | Plot | Plot | Plot |
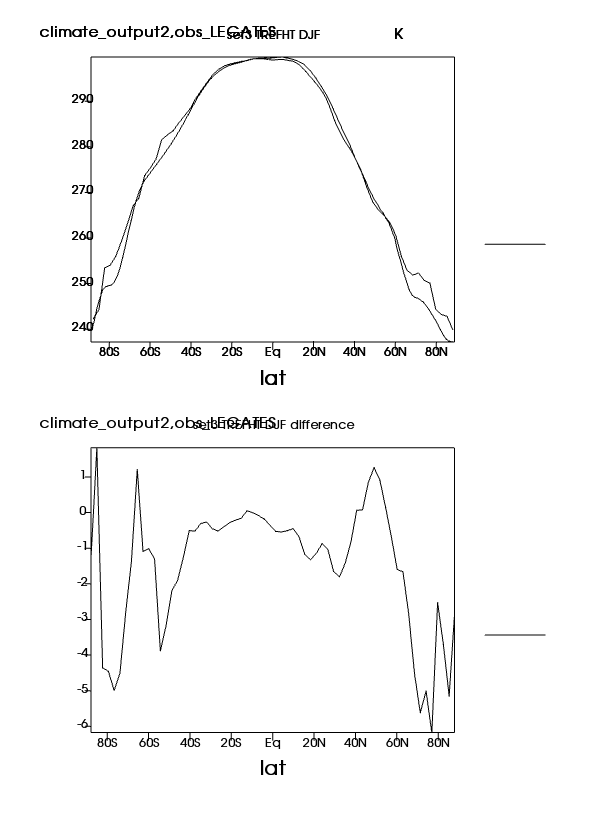
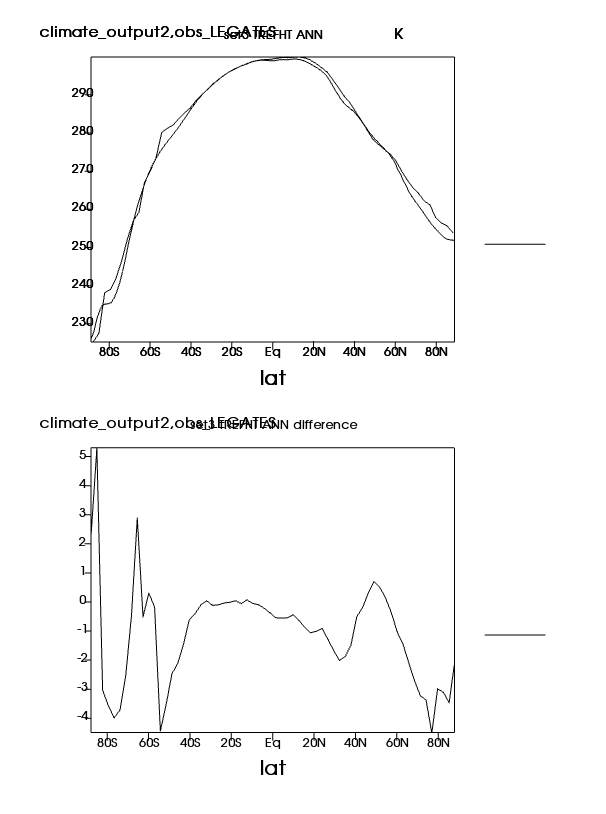
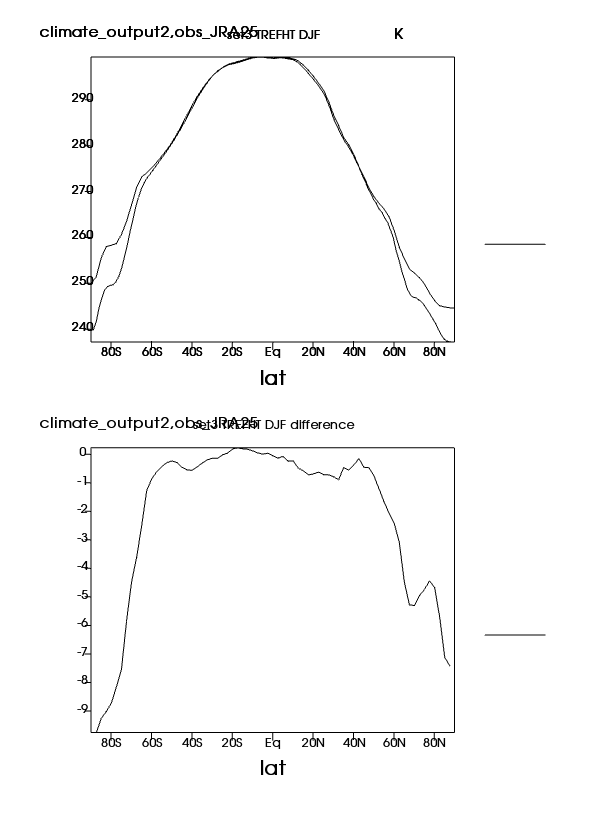
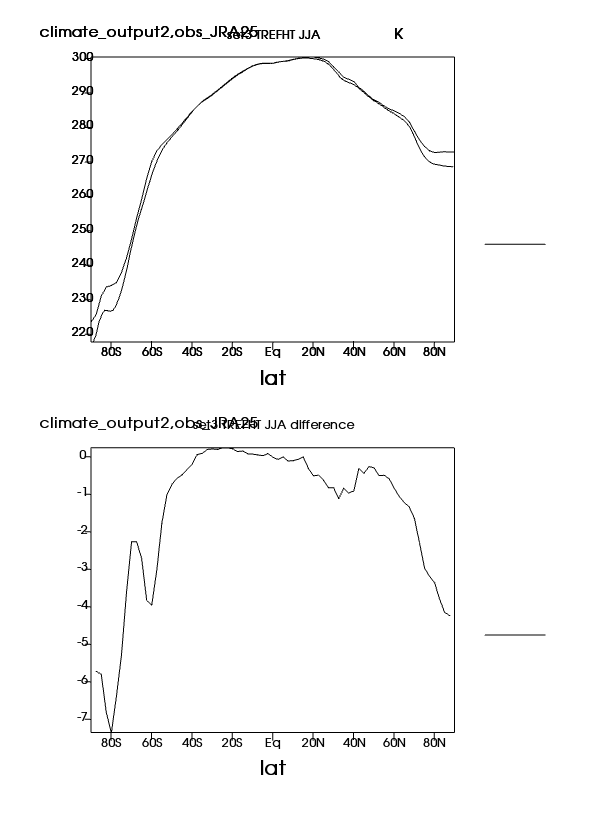
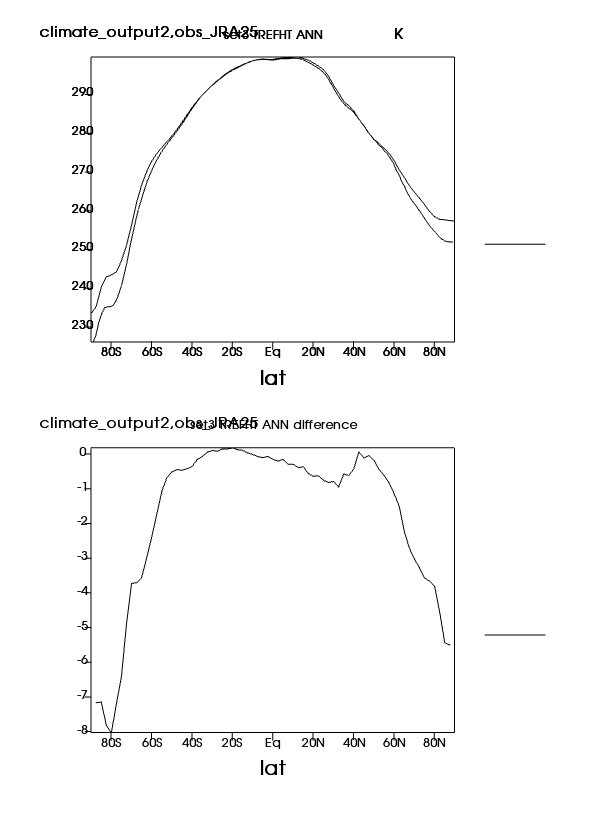
| TREFHT | 2-meter air temperature (land) | Plot | Plot | Plot |
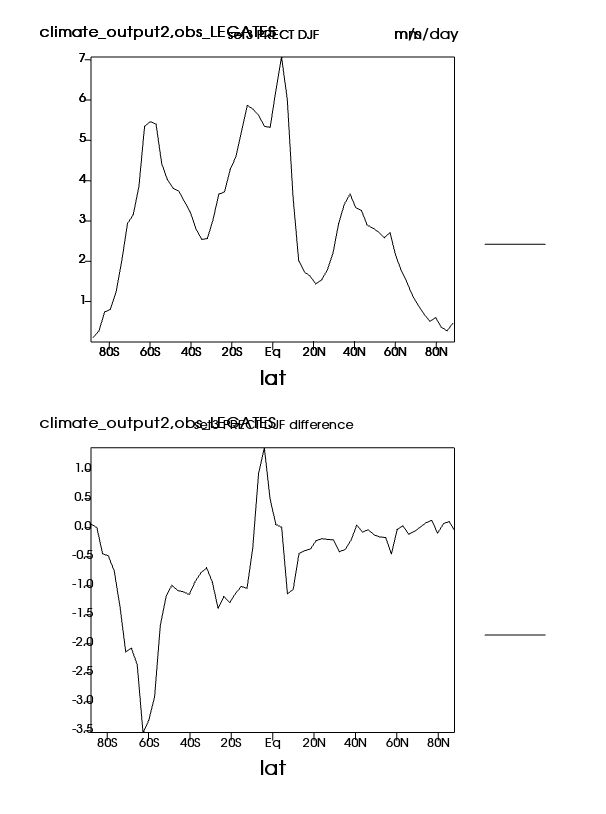
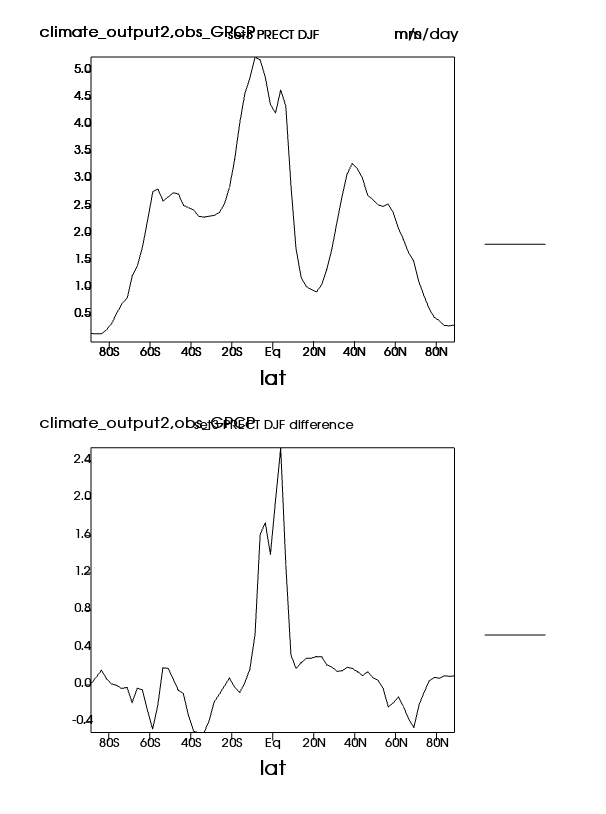
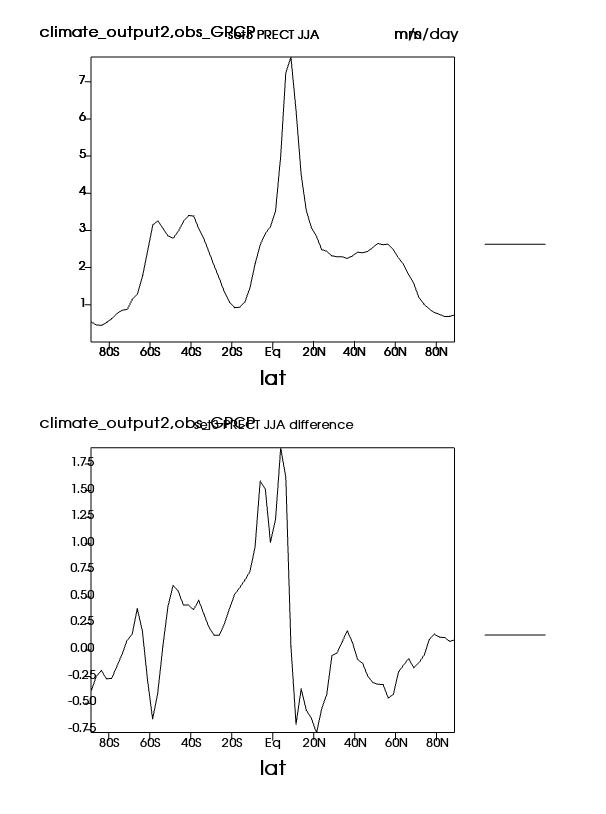
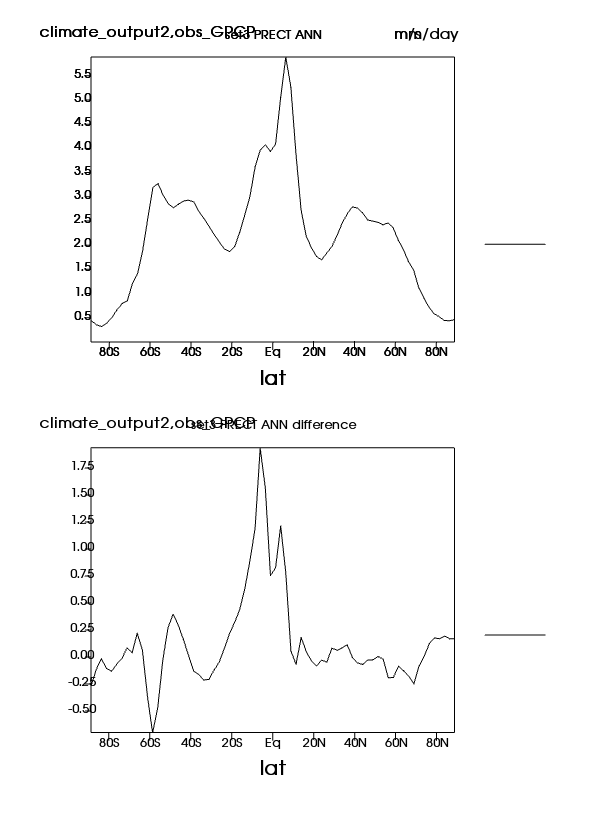
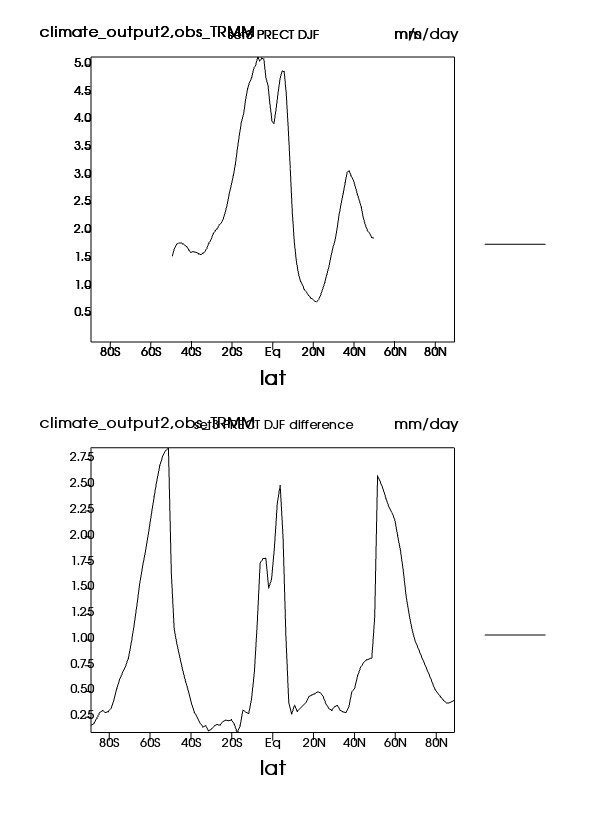
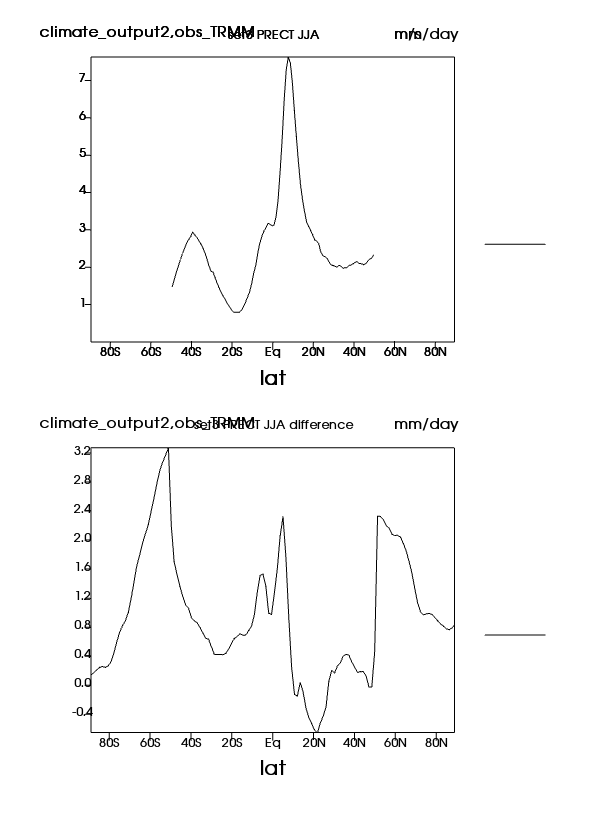
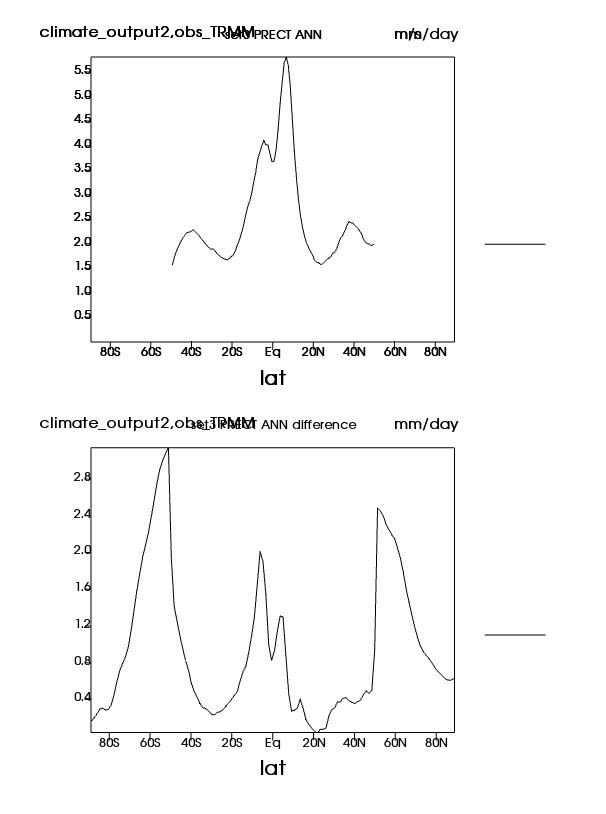
| PRECT | Precipitation rate | Plot | Plot | Plot |
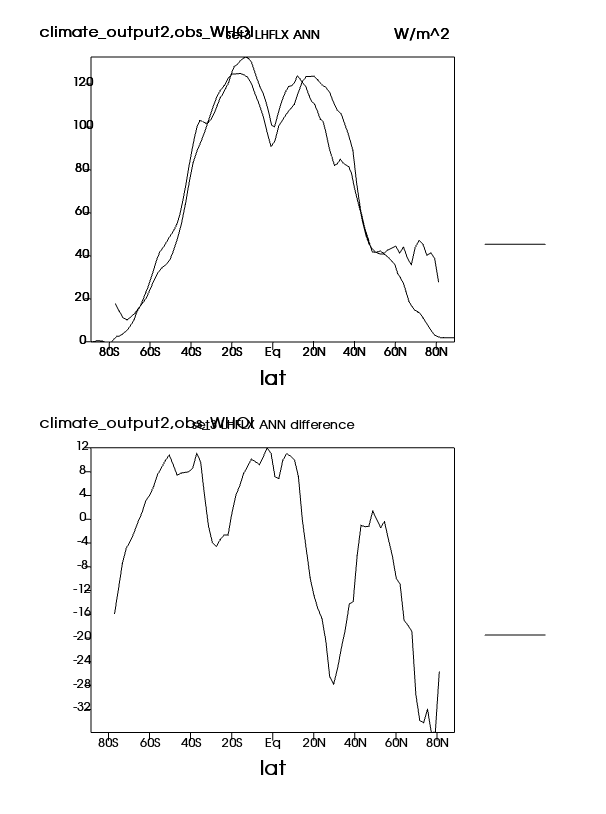
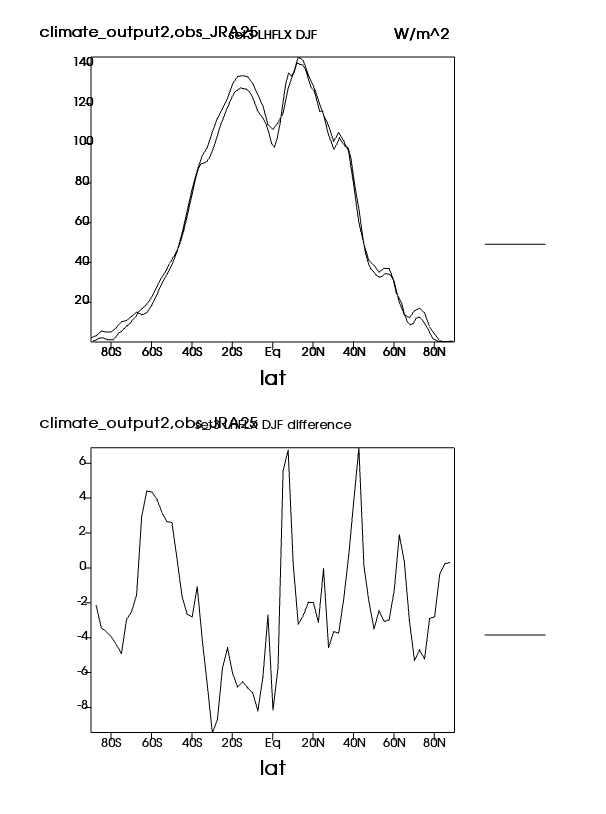
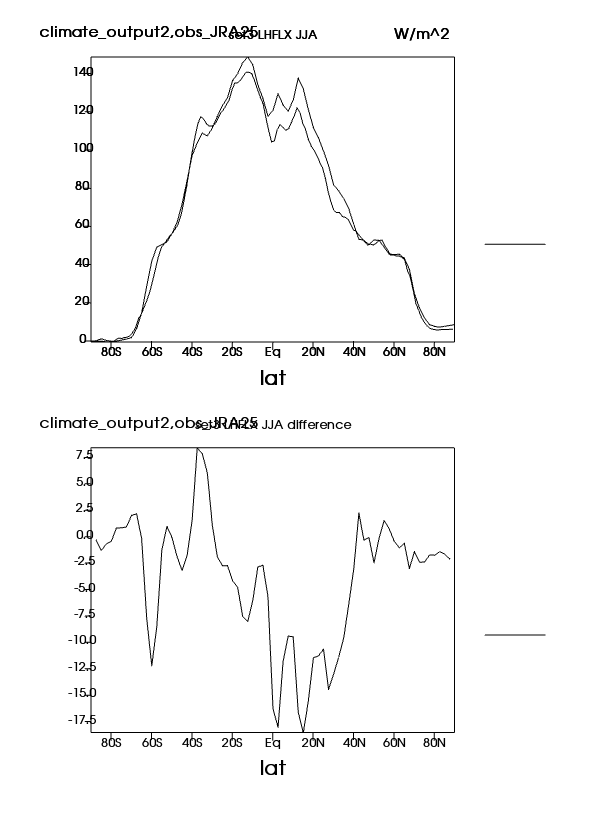
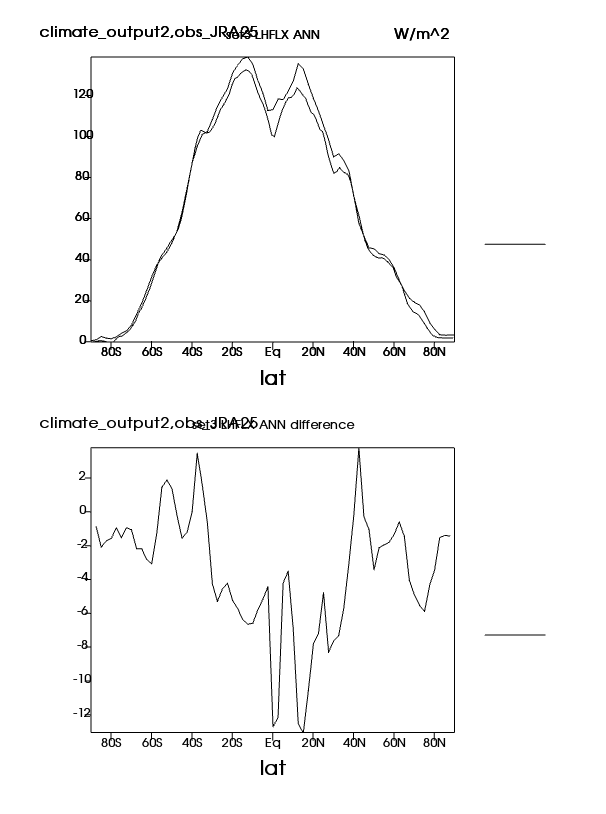
| LHFLX | Surface latent heat flux | Plot | Plot | Plot |
| PREH2O | Total precipitable water | Plot | Plot | Plot |
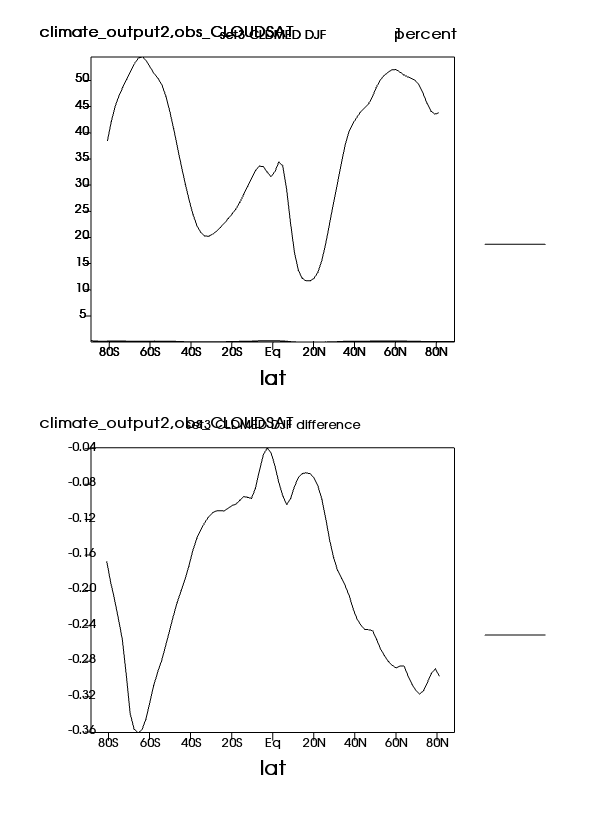
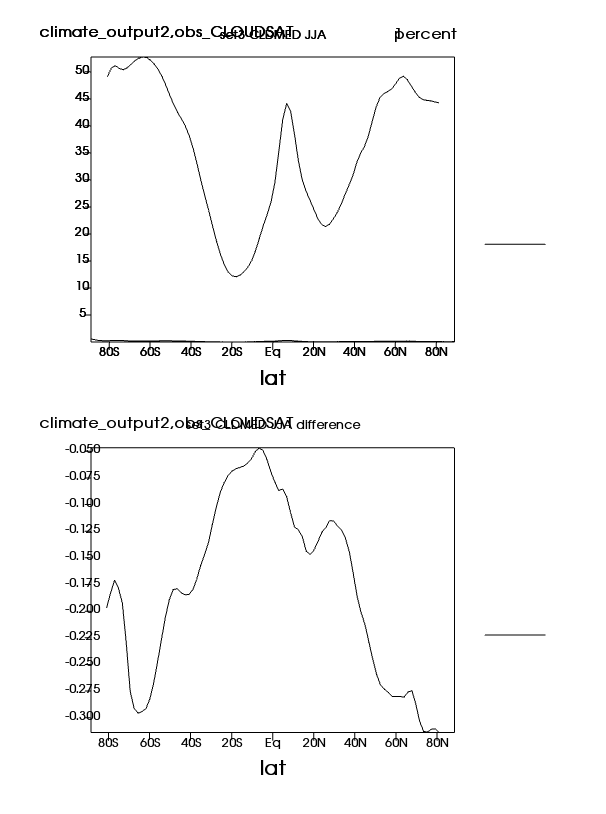
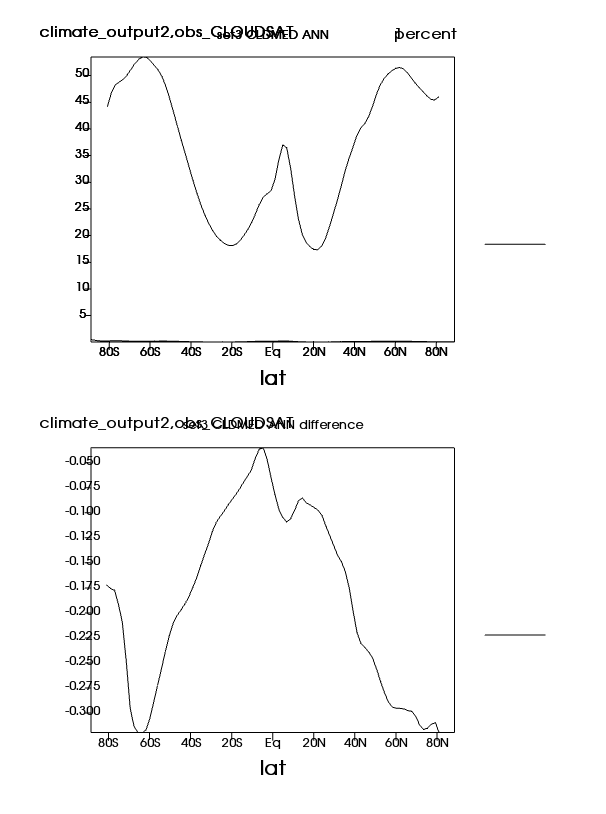
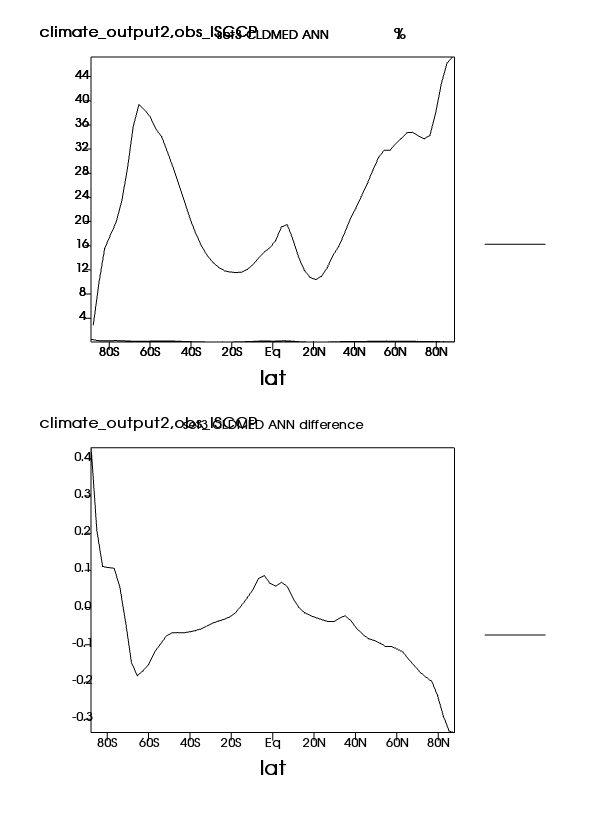
| CLDMED | Mid cloud amount (IR clouds) (Northern) | Plot | Plot | Plot |
| CLDLOW | Low cloud amount (IR clouds) | Plot | Plot | Plot |
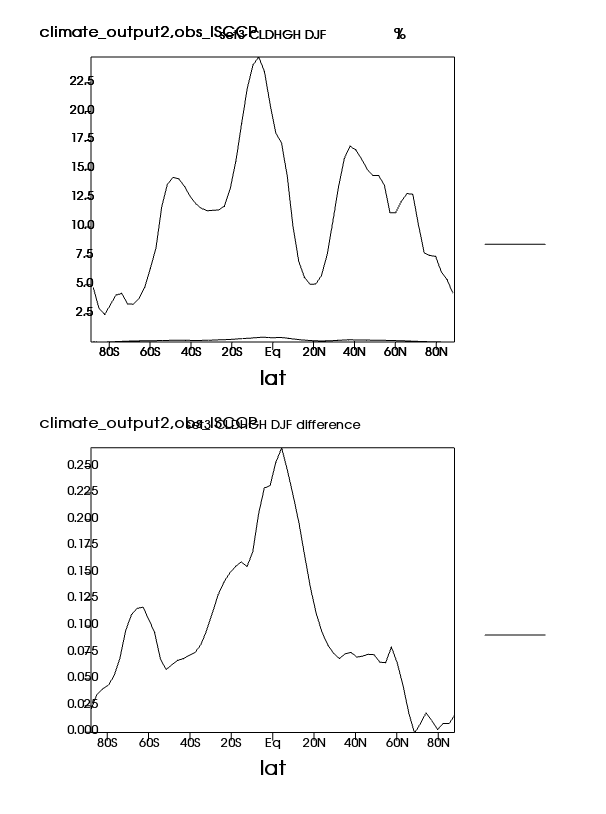
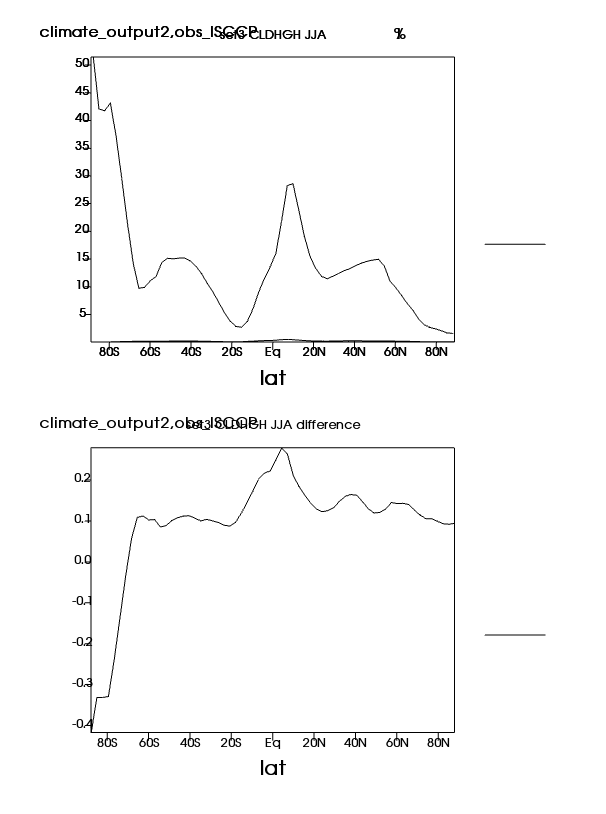
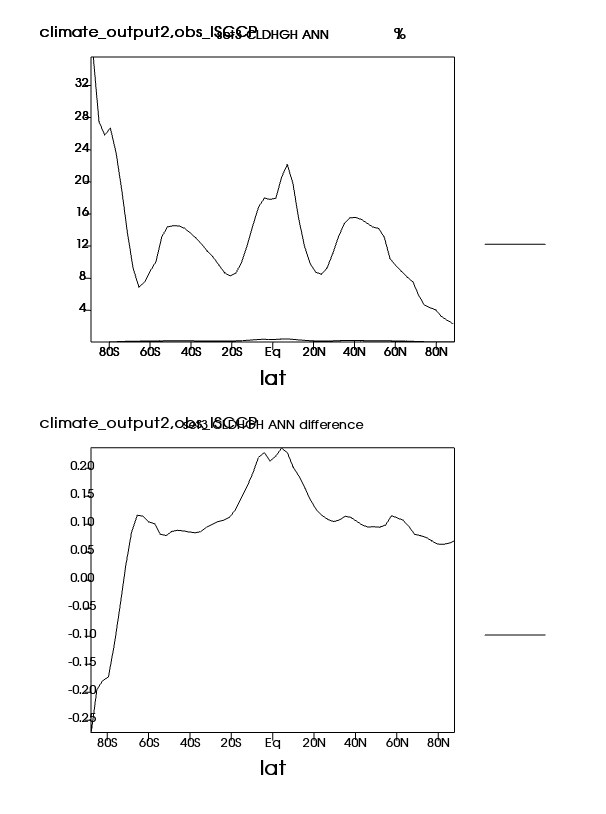
| CLDHGH | High cloud amount (IR clouds) | Plot | Plot | Plot |
| LHFLX | Surface latent heat flux | Plot | Plot | Plot |
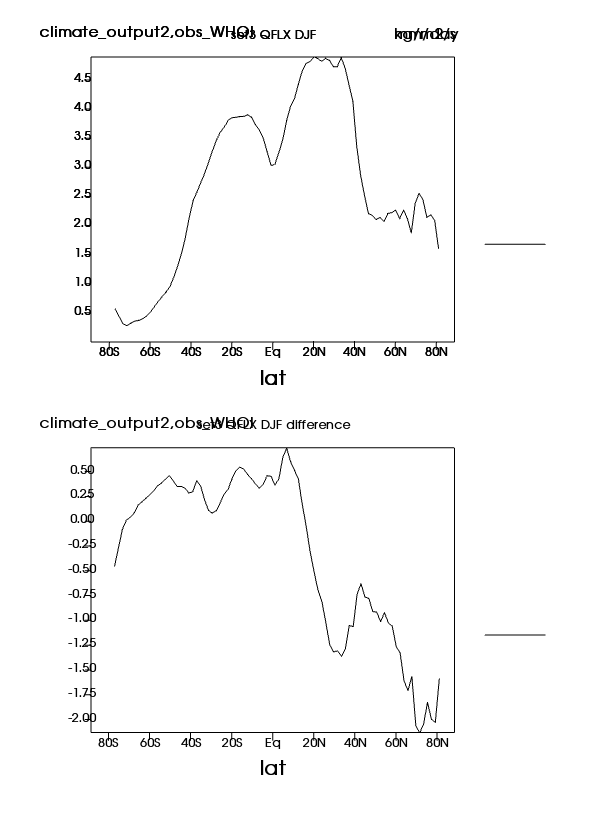
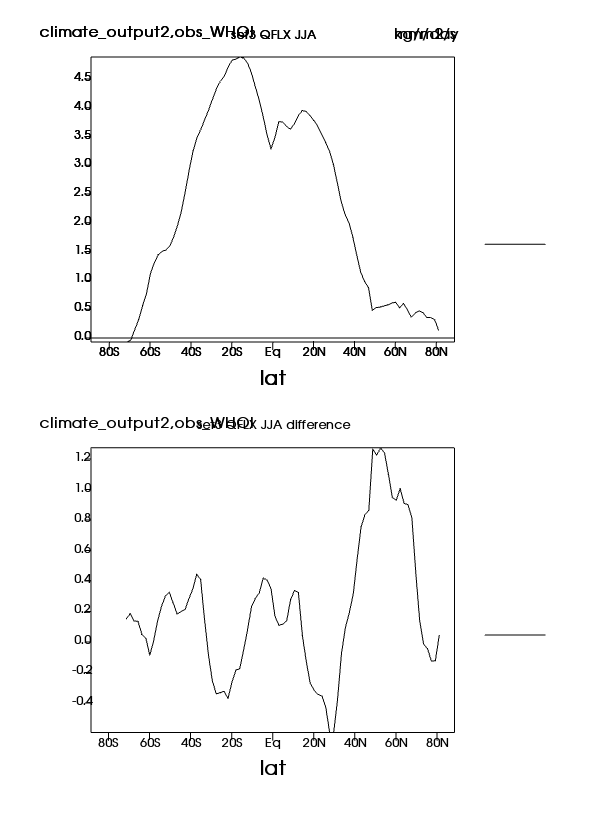
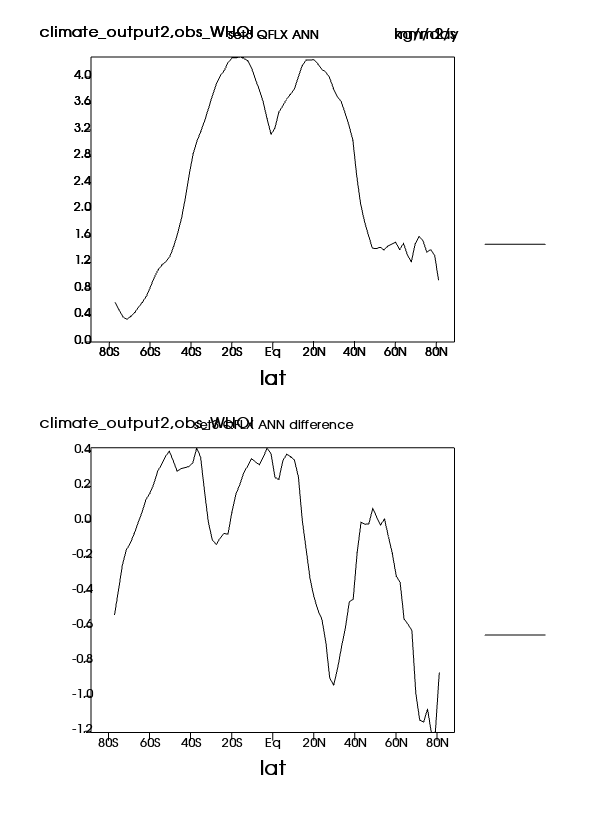
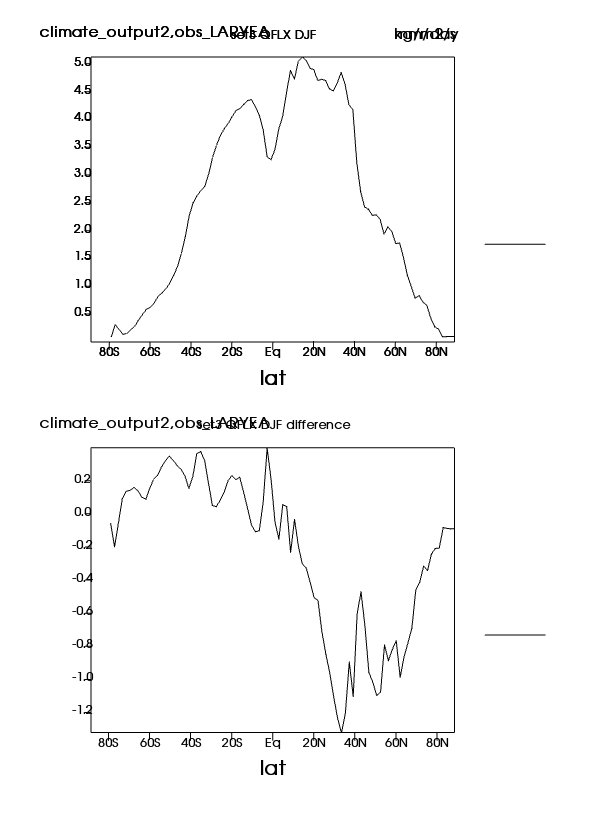
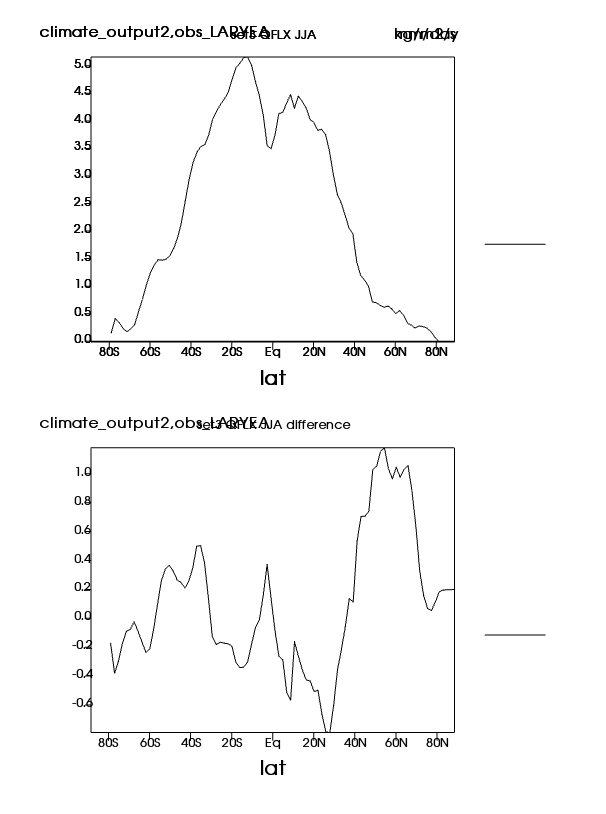
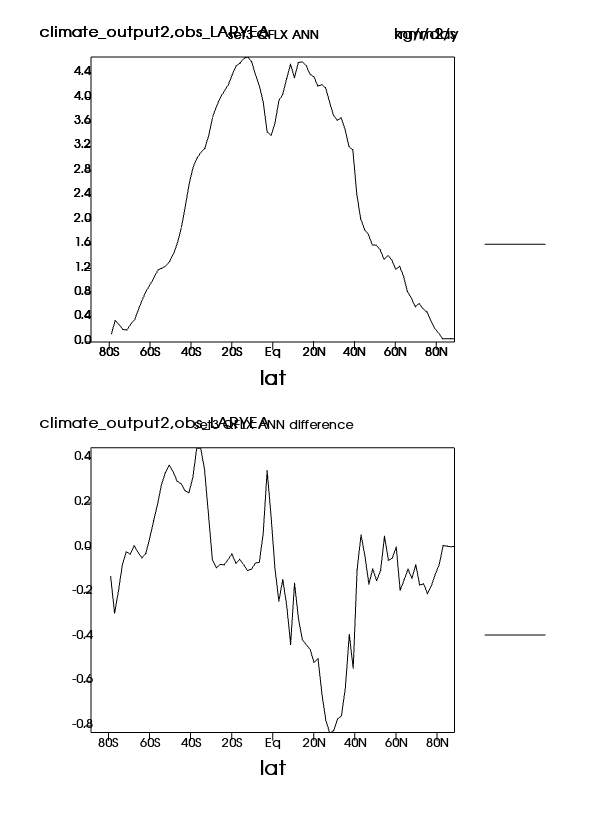
| QFLX | Surface water flux (Northern) | Plot | Plot | Plot |
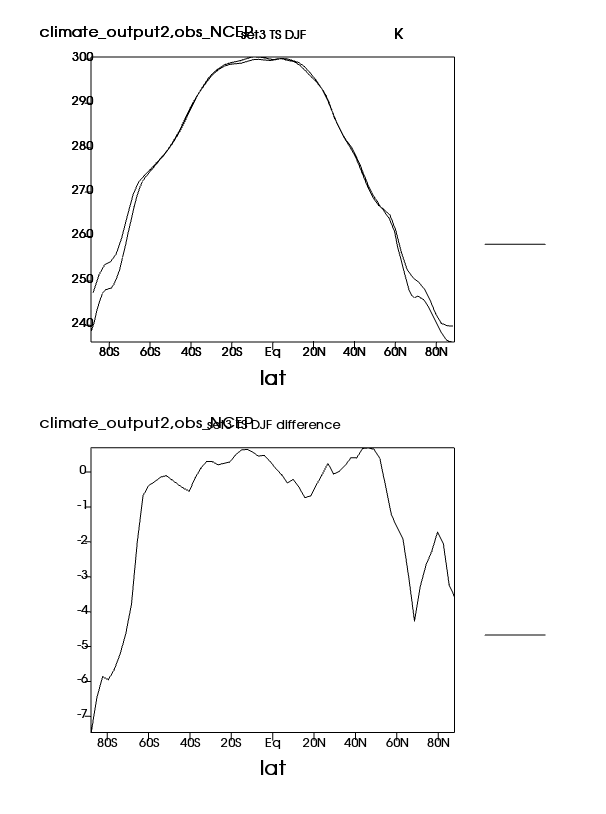
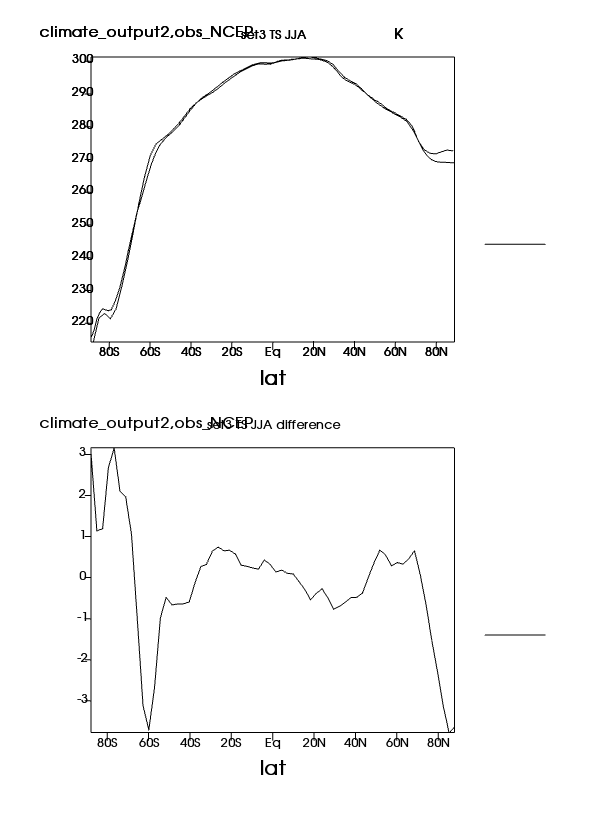
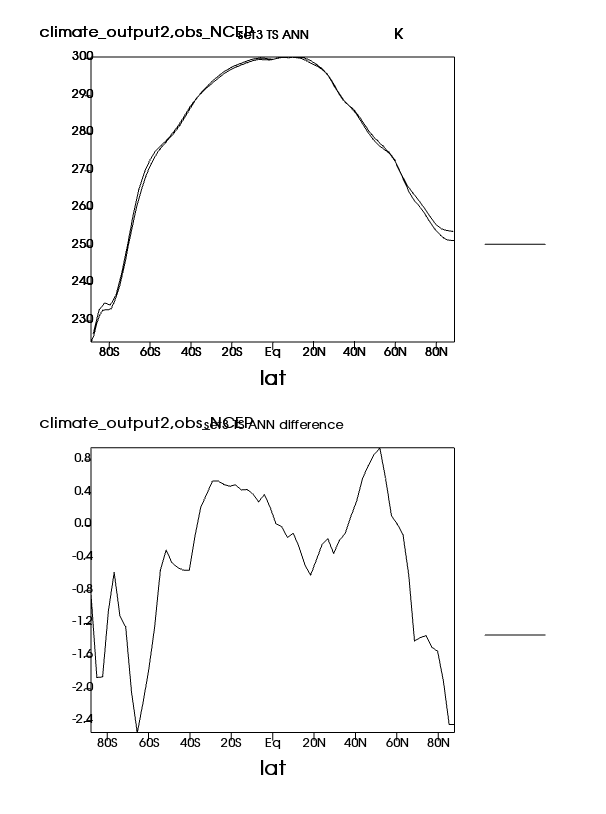
| TS | Surface temperature | Plot | Plot | Plot |
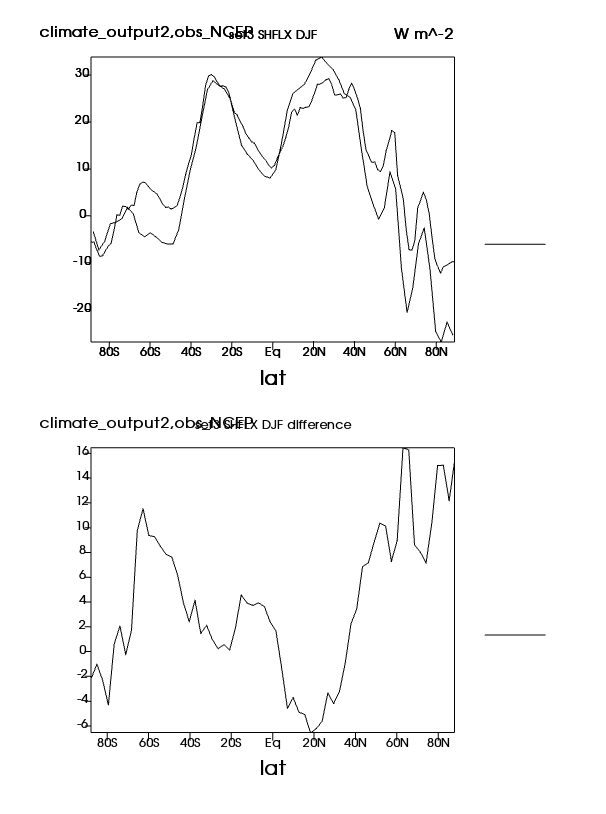
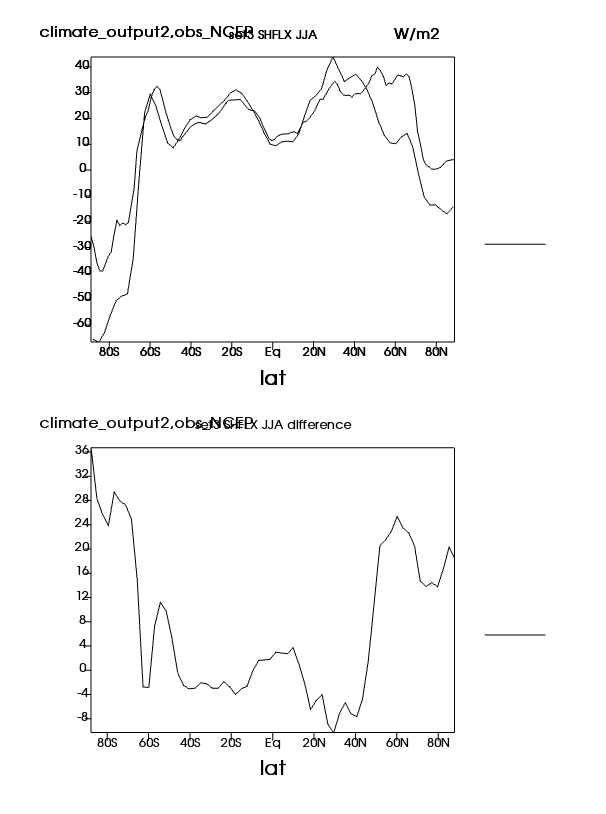
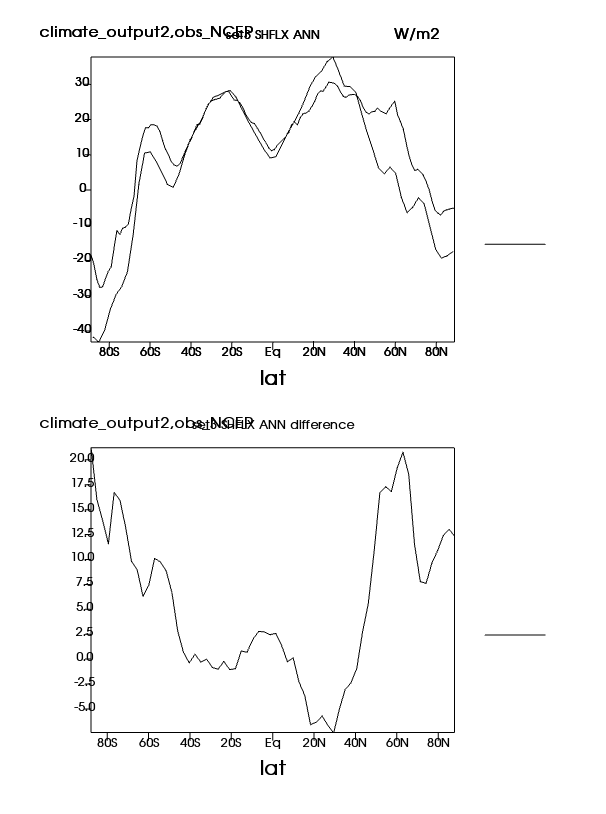
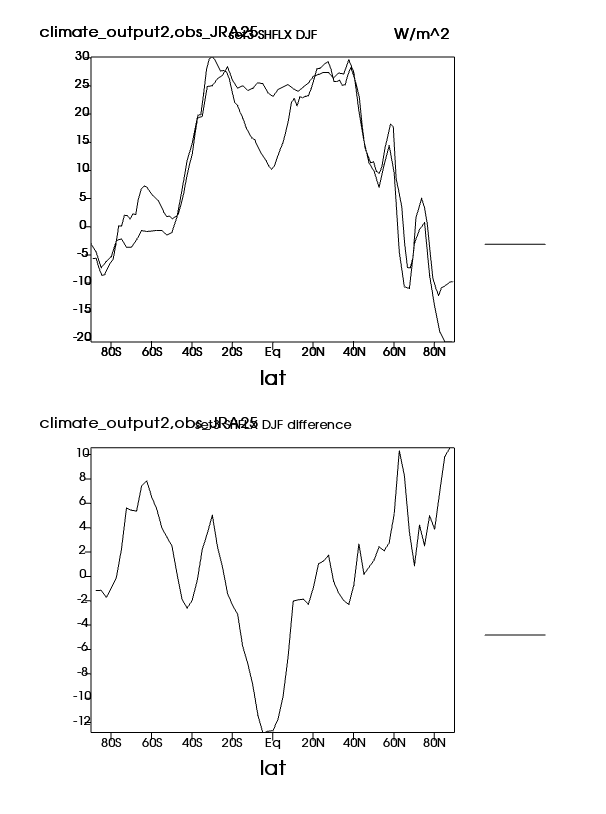
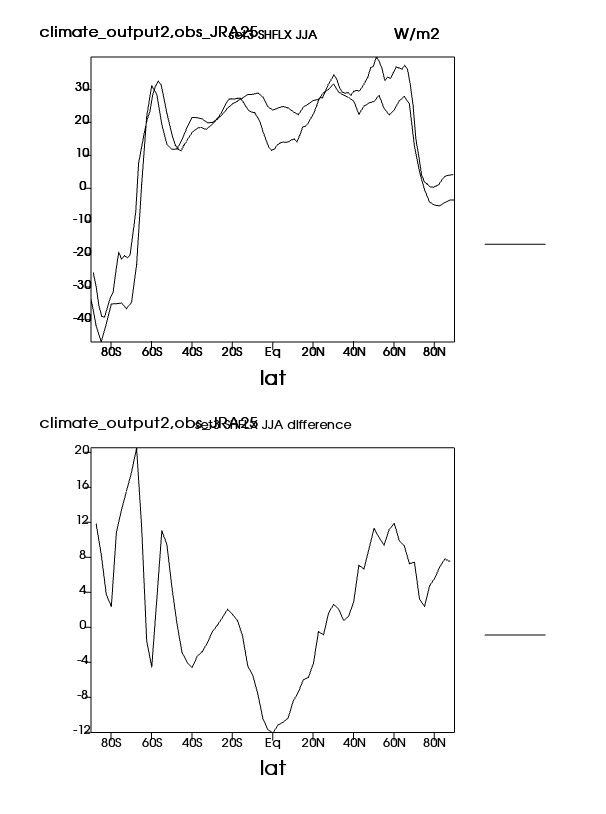
| SHFLX | Surface sensible heat flux | Plot | Plot | Plot |
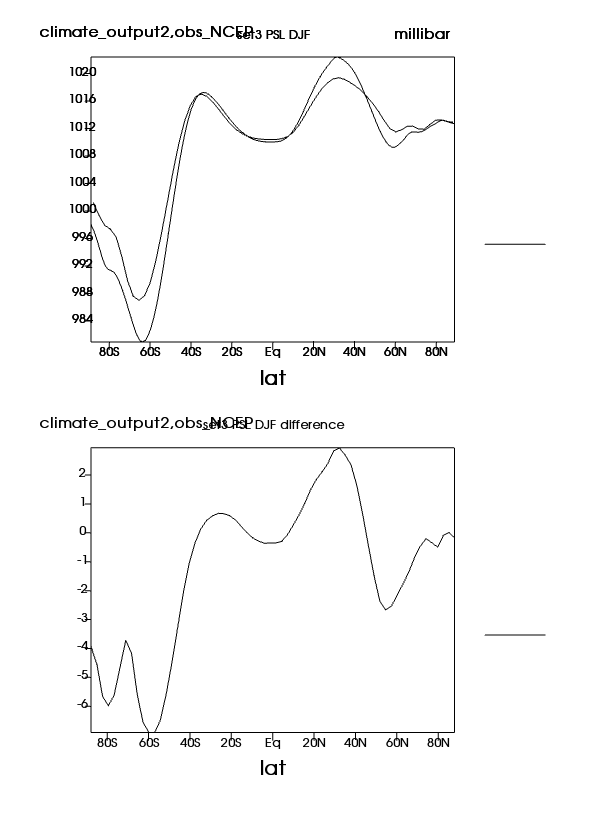
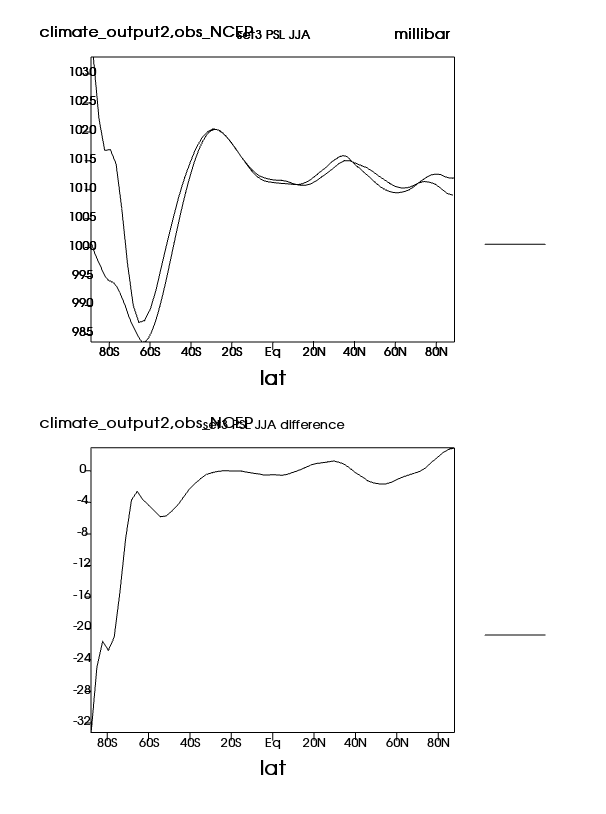
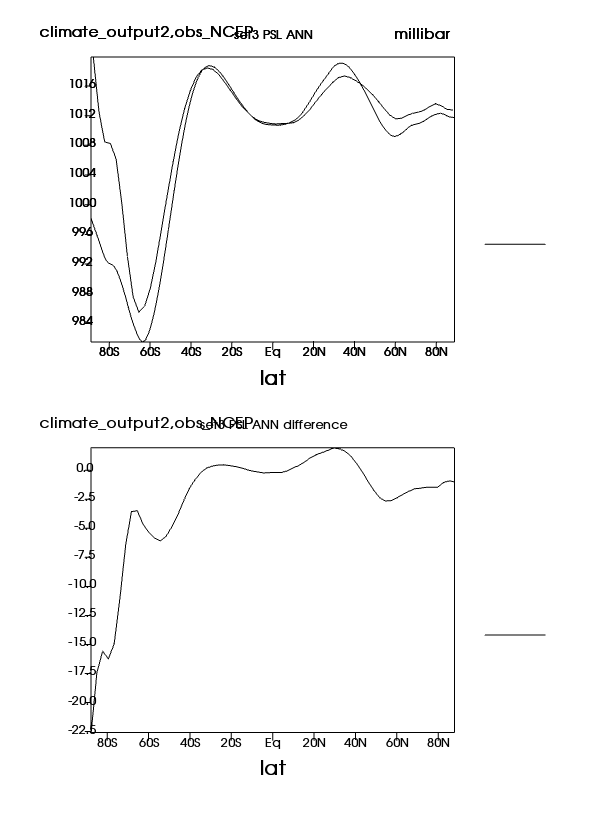
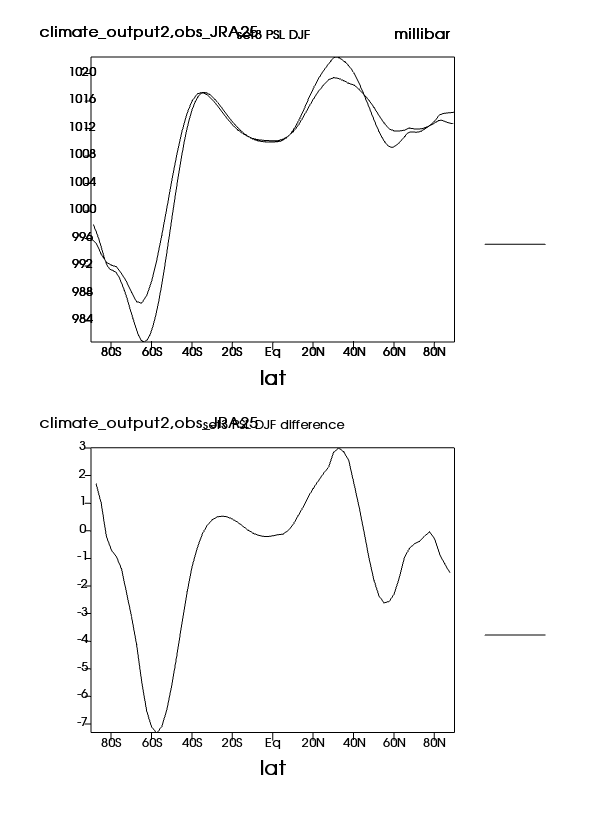
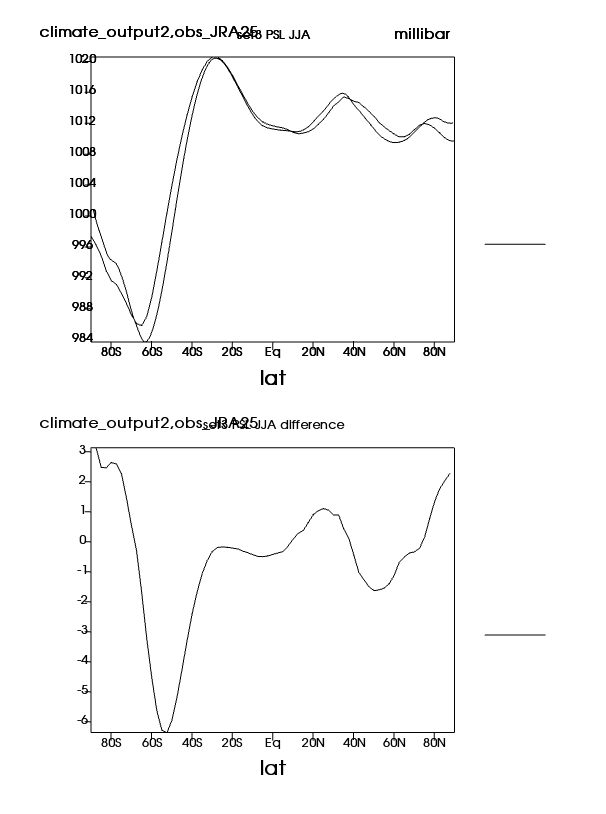
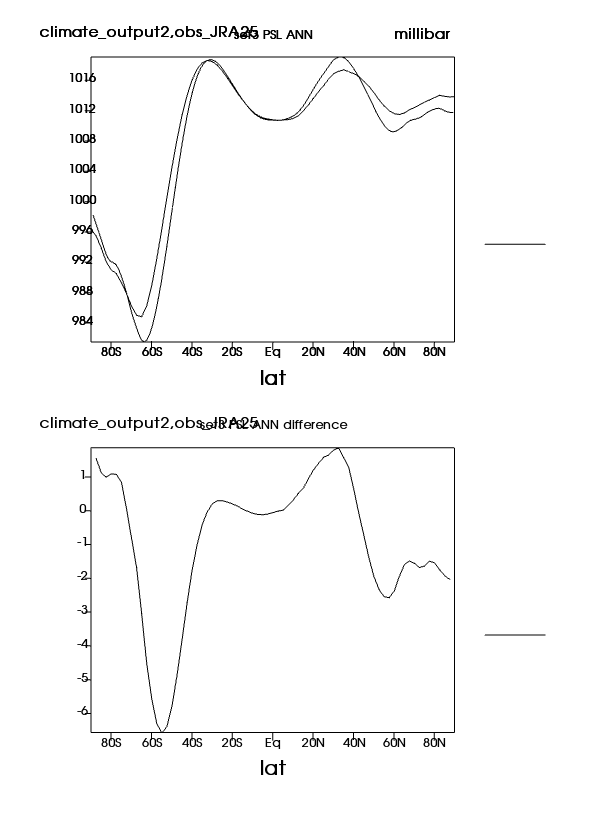
| PSL | Sea-level pressure (Northern) | Plot | Plot | Plot |
| PREH2O | Total precipitable water | Plot | Plot | Plot |
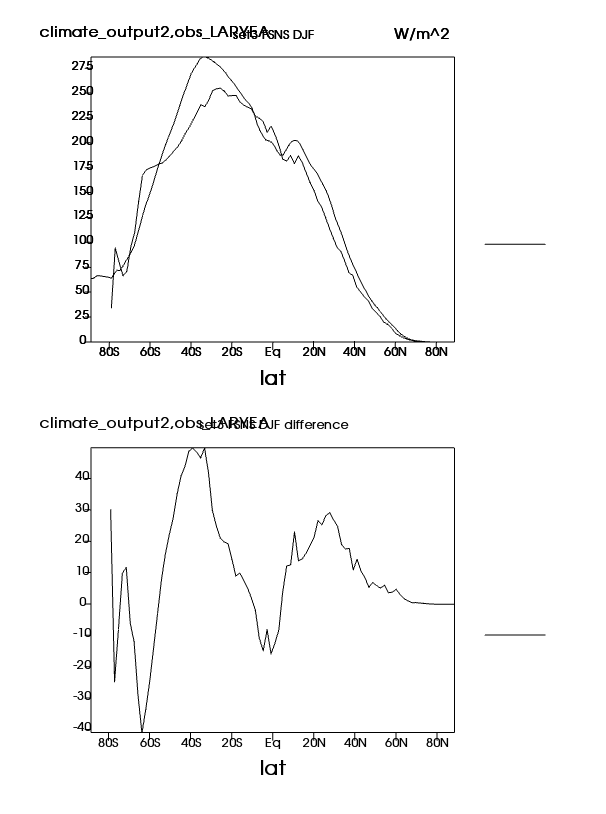
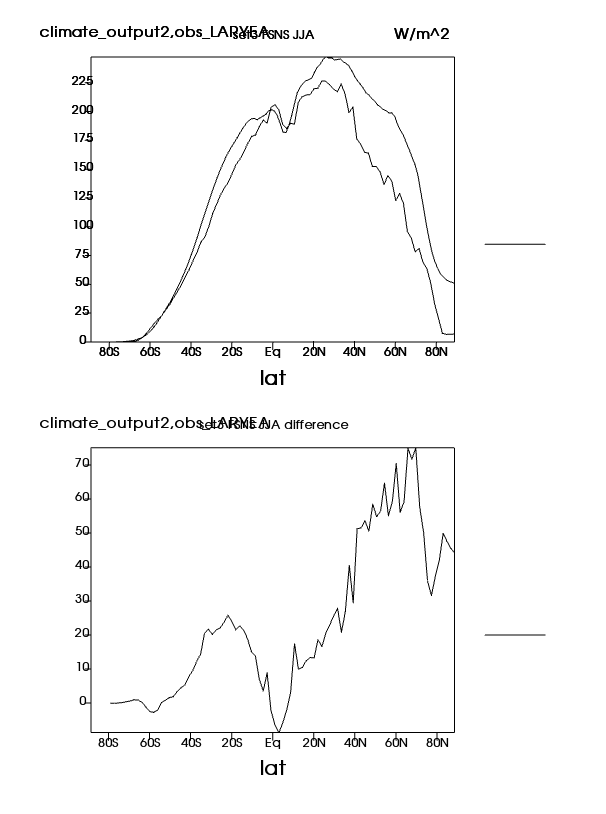
| LHFLX | Surface latent heat flux | Plot | Plot | Plot |
| SHFLX | Surface sensible heat flux | Plot | Plot | Plot |
| TREFHT | 2-meter air temperature (land) | Plot | Plot | Plot |
| PSL | Sea-level pressure (Northern) | Plot | Plot | Plot |
| PREH2O | Total precipitable water | Plot | Plot | Plot |
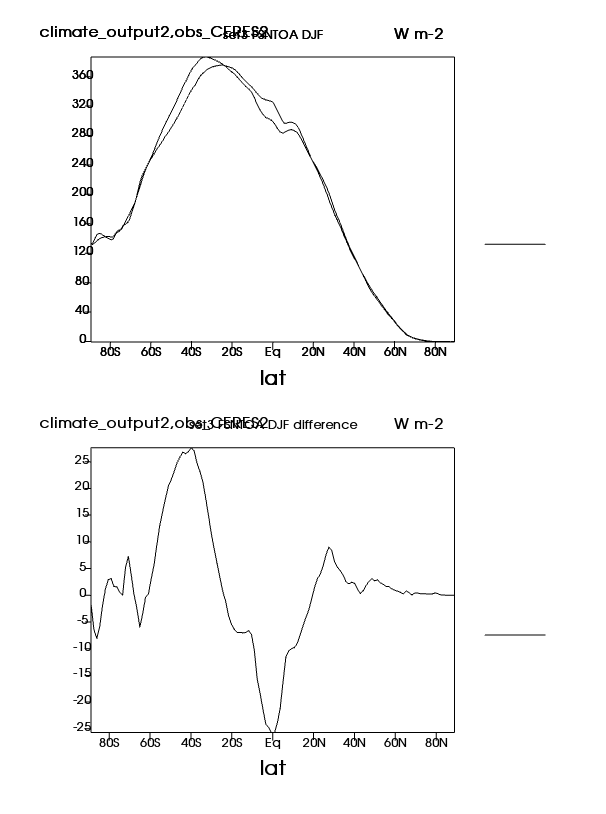
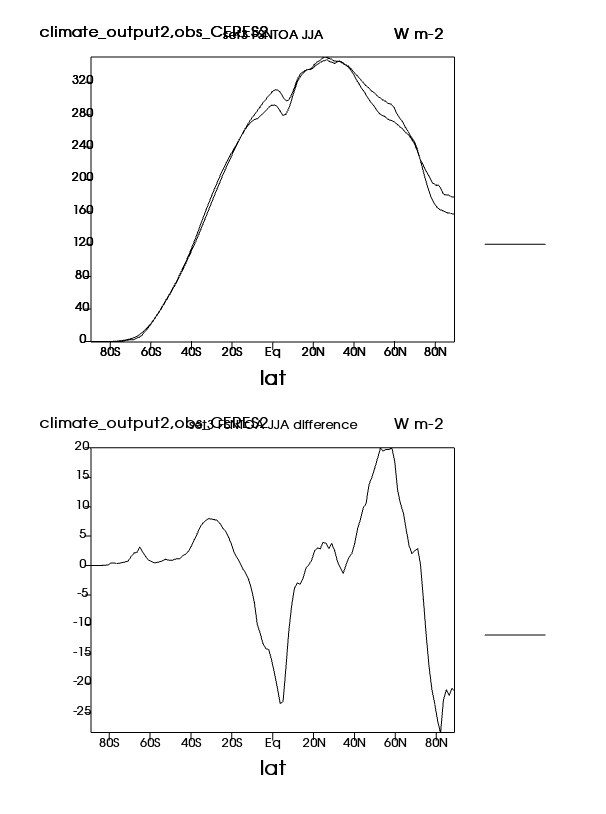
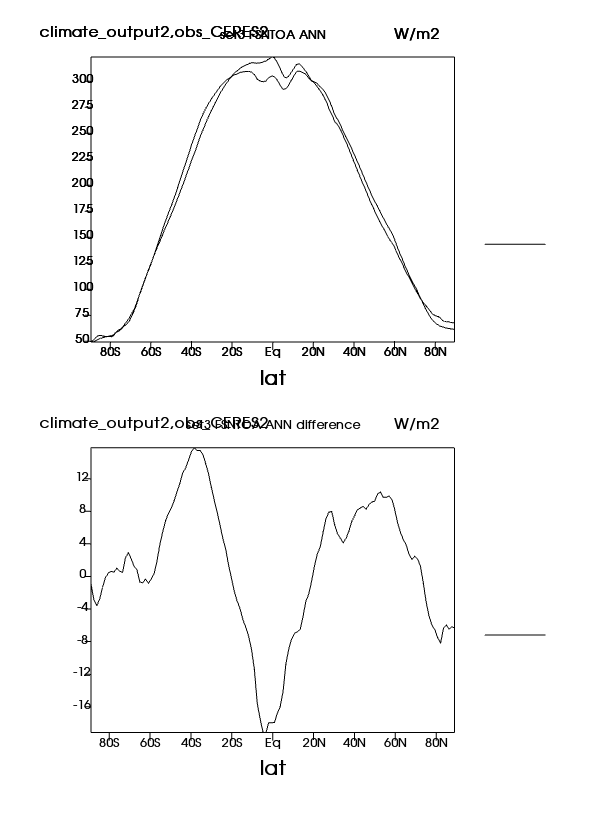
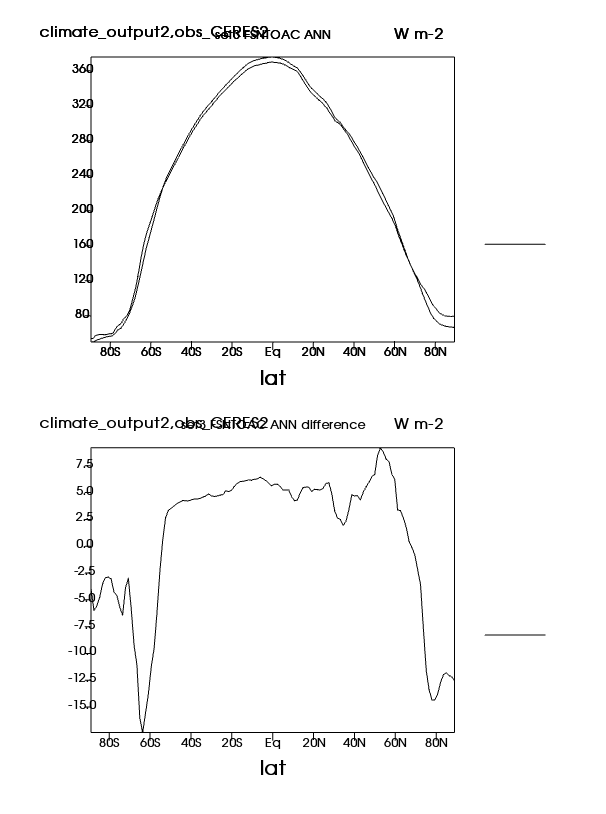
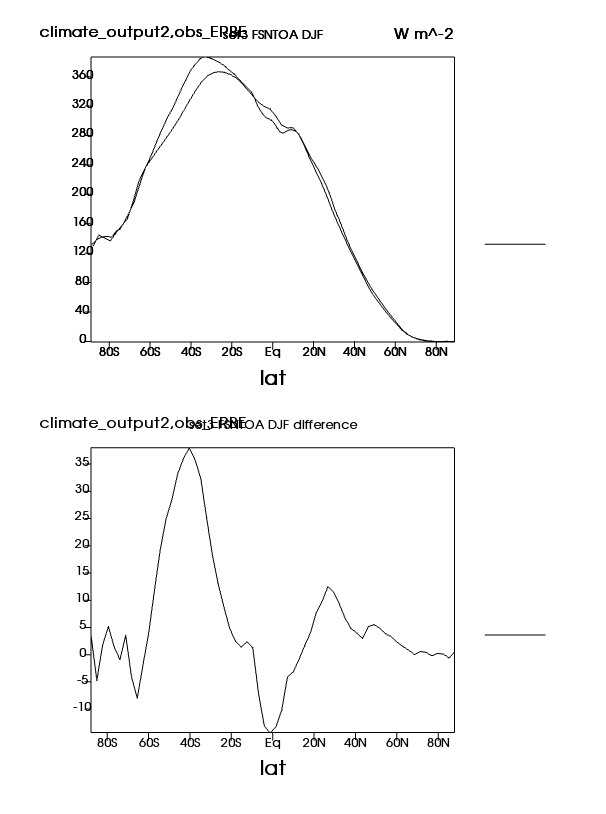
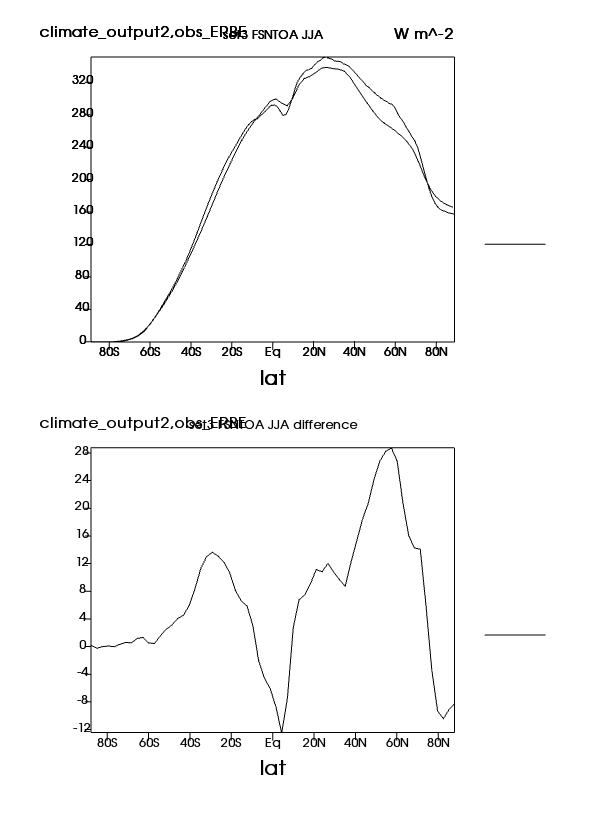
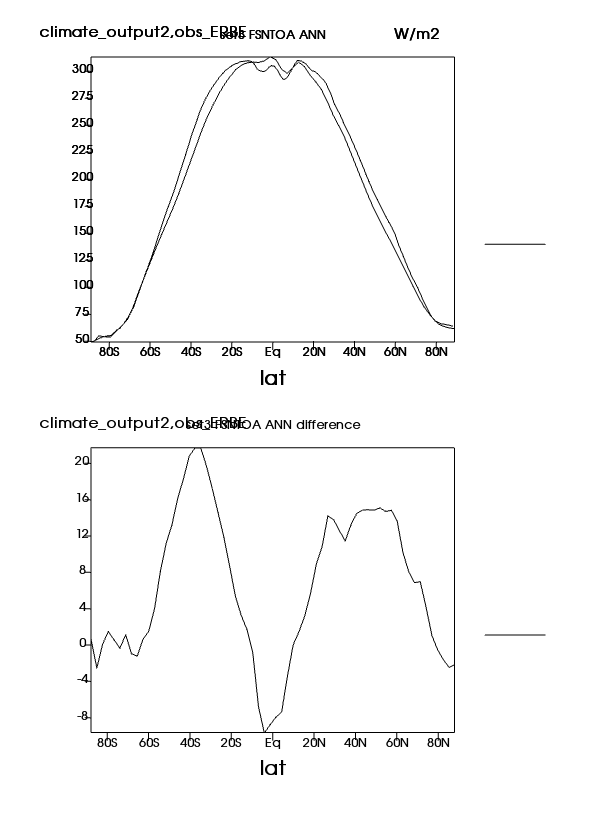
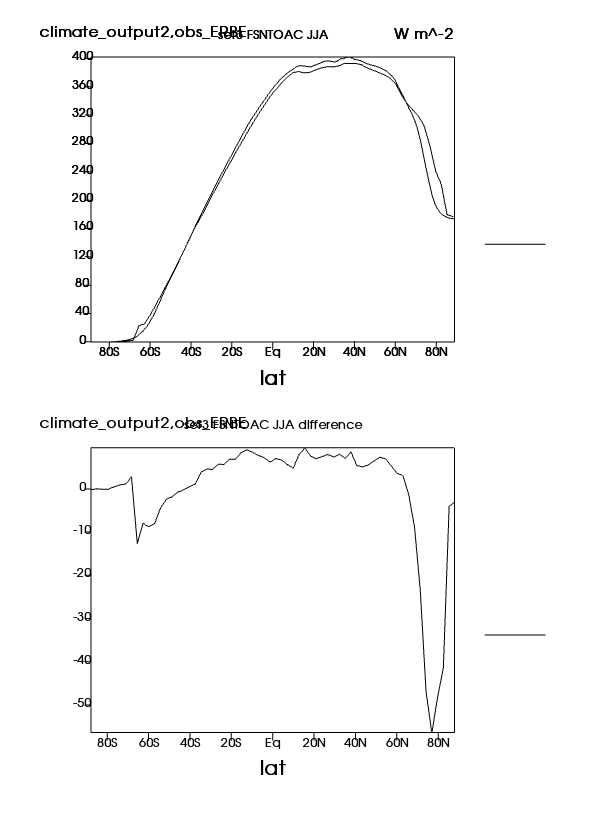
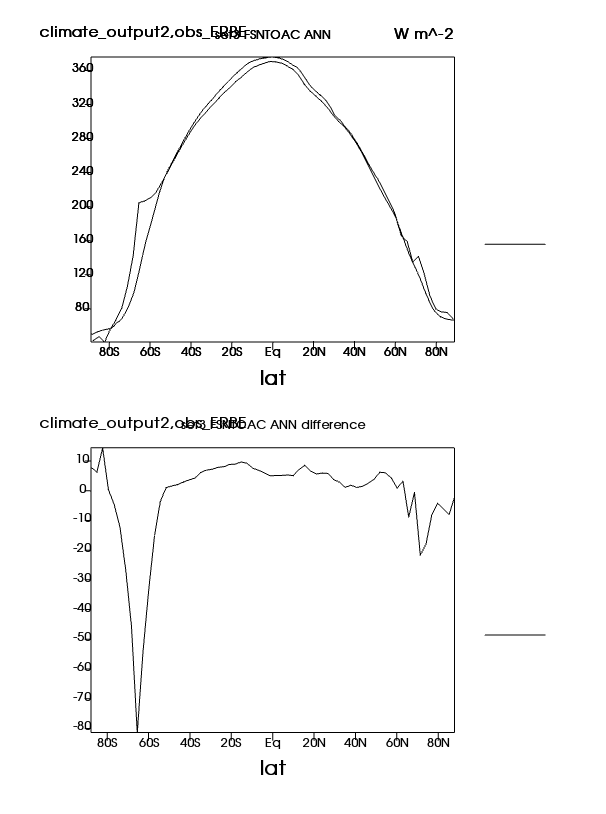
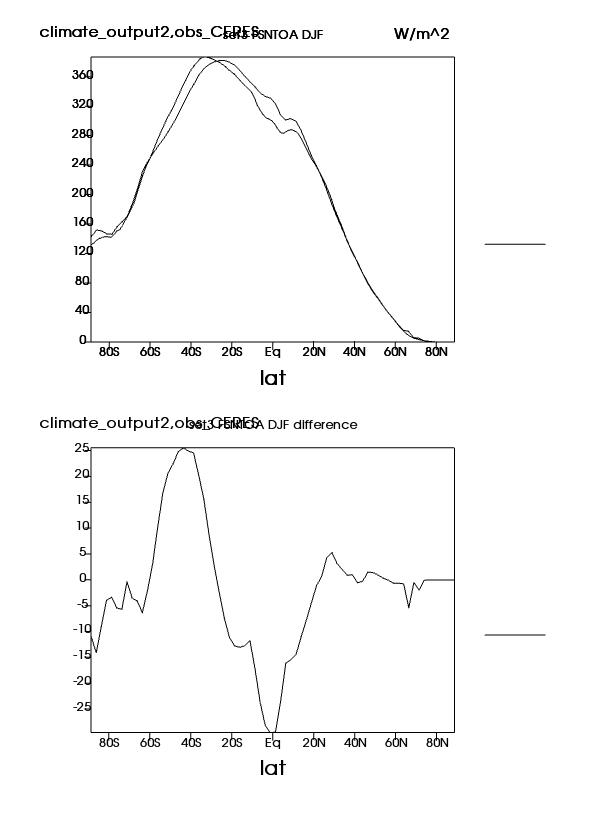
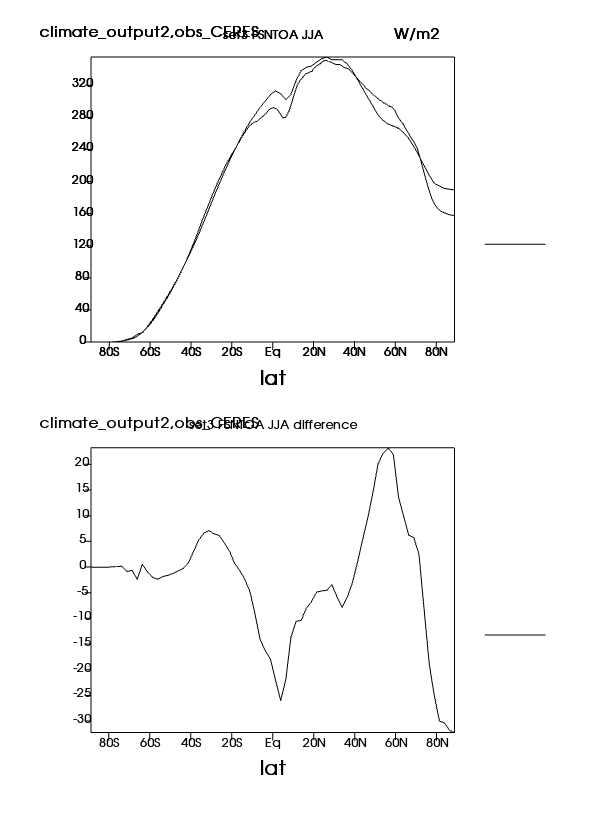
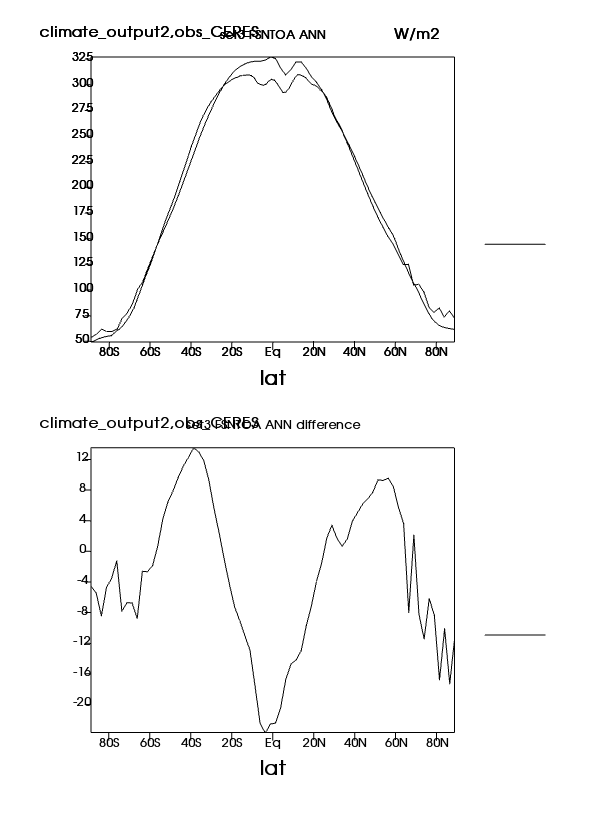
| FSNTOA | TOA net SW flux (Northern) | Plot | Plot | Plot |
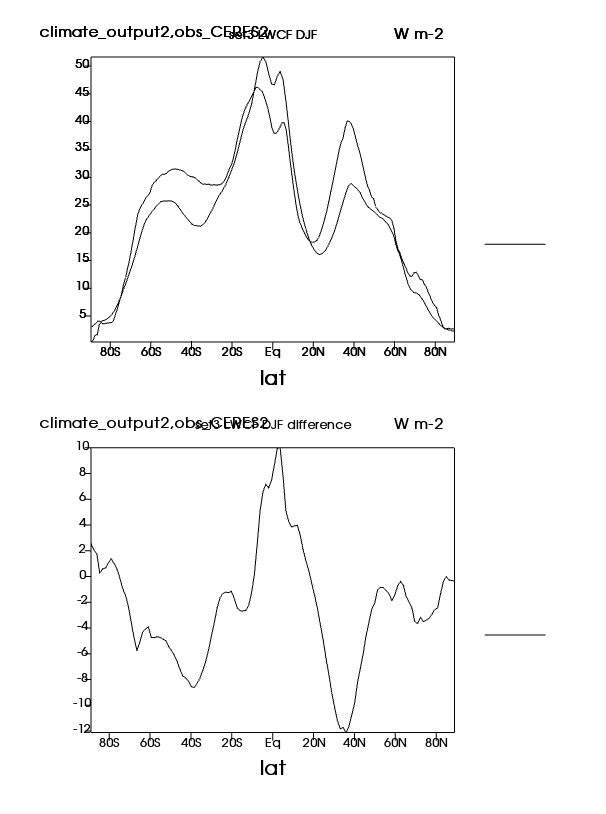
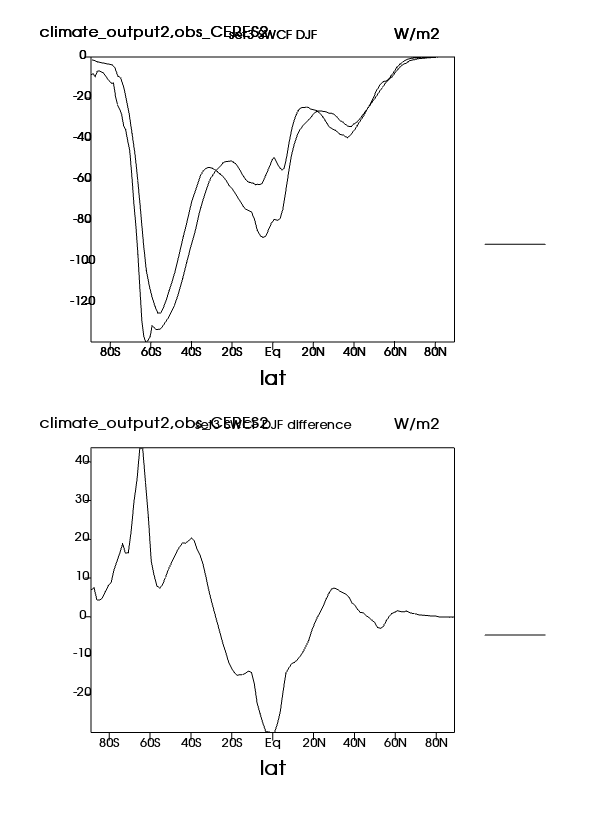
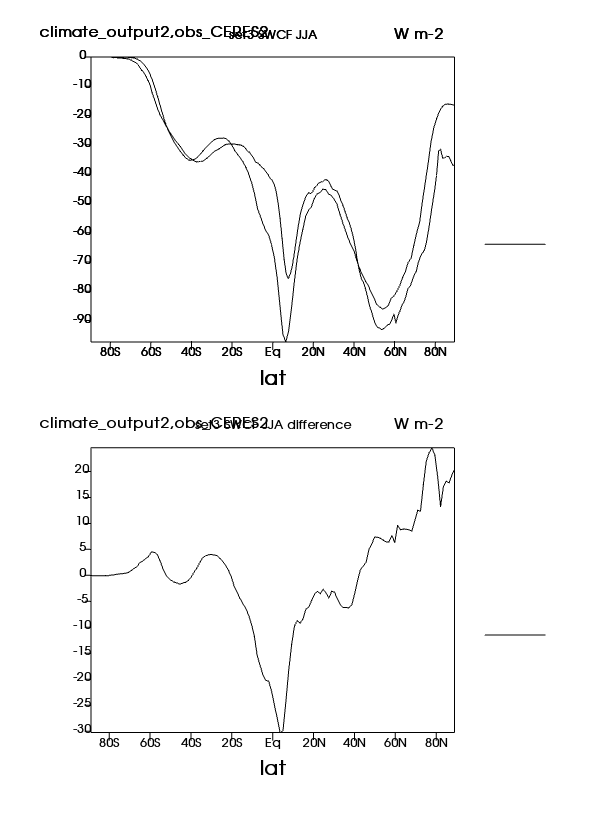
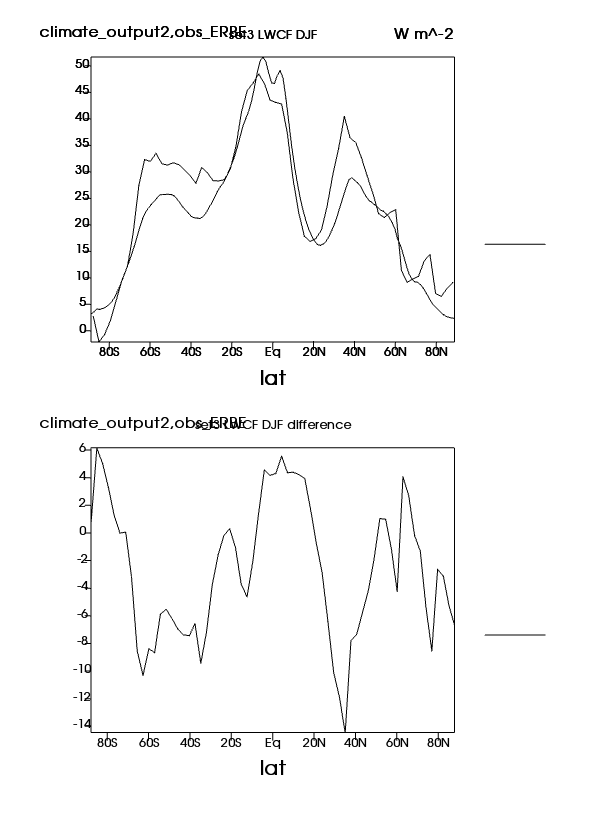
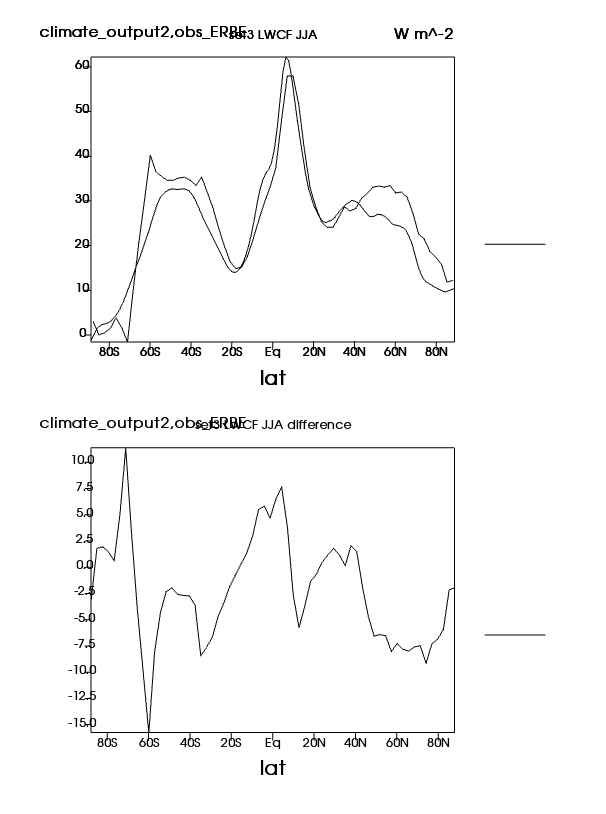
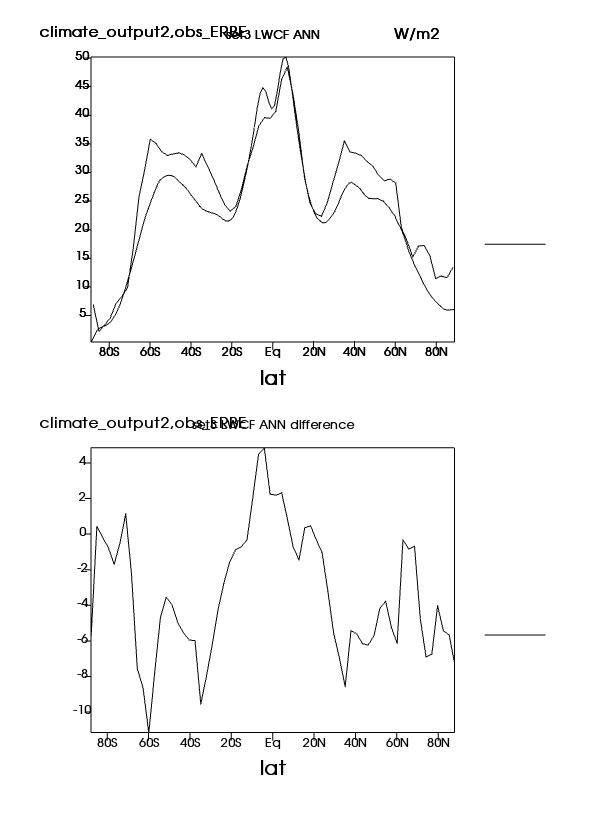
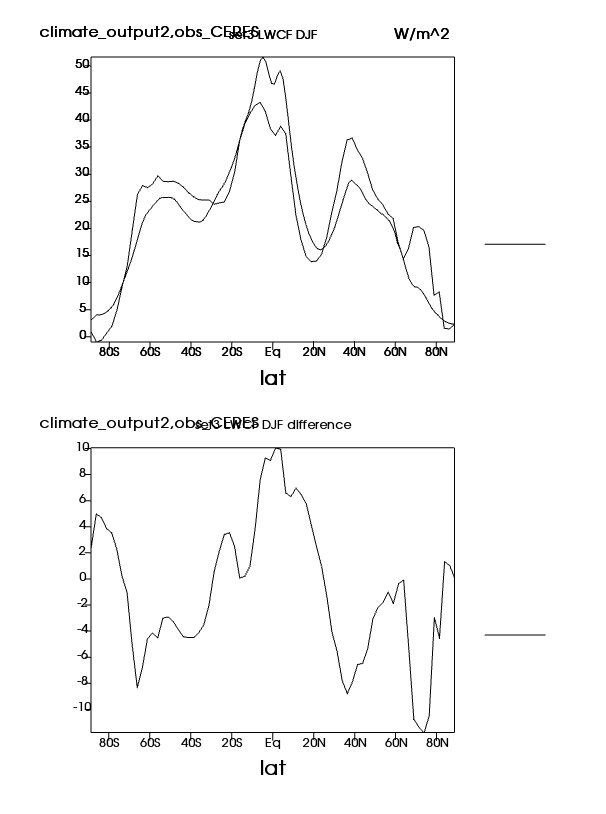
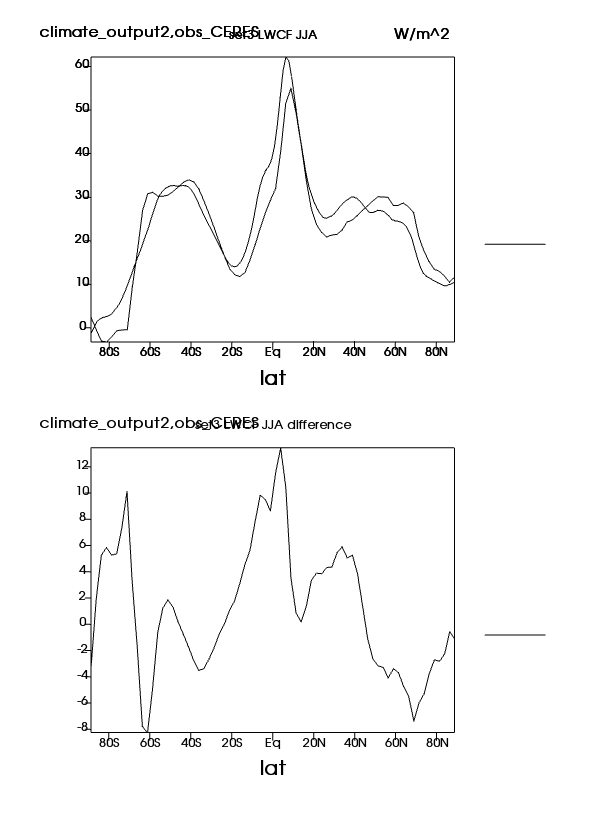
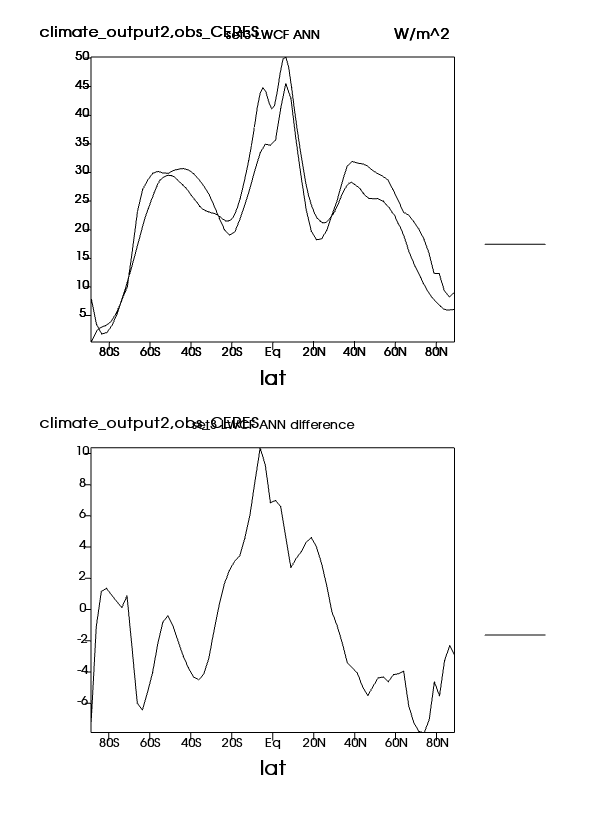
| LWCF | TOA longwave cloud forcing | Plot | Plot | Plot |
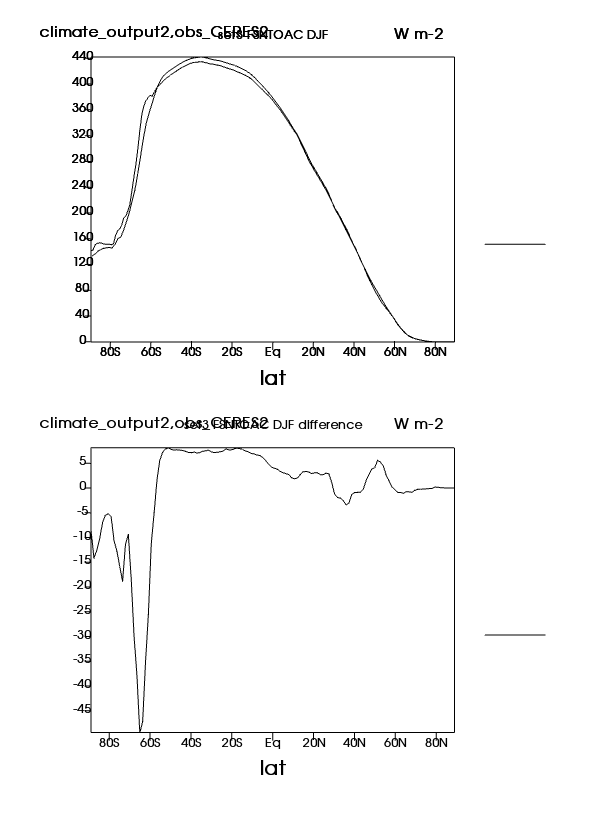
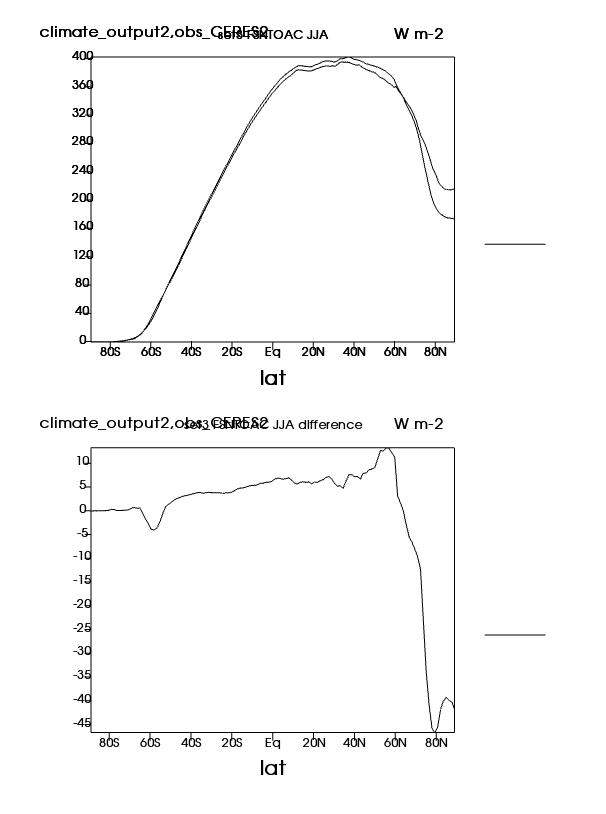
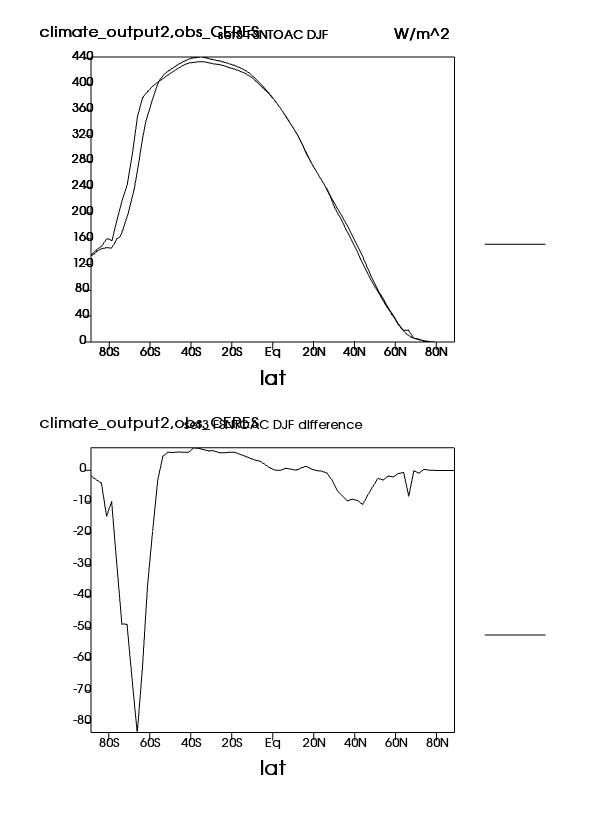
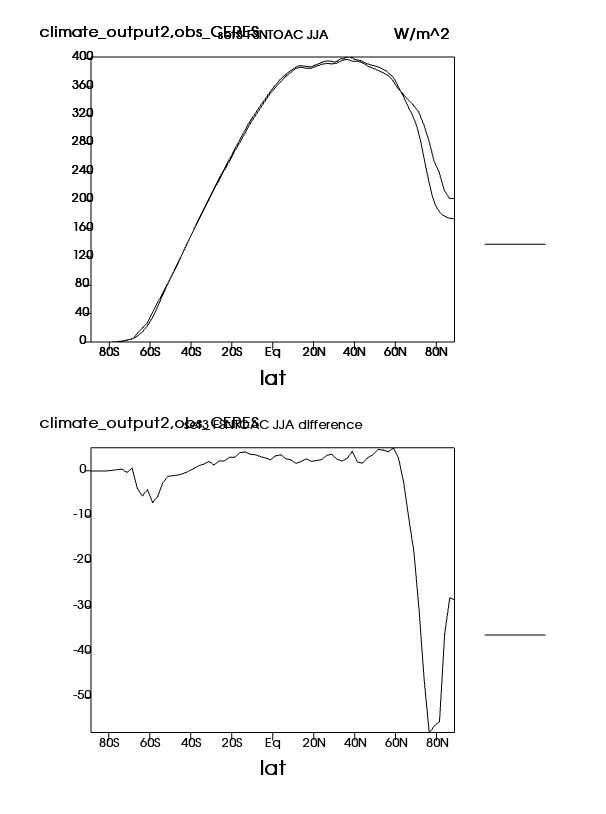
| FSNTOAC | TOA clearsky net SW flux (Northern) | Plot | Plot | Plot |
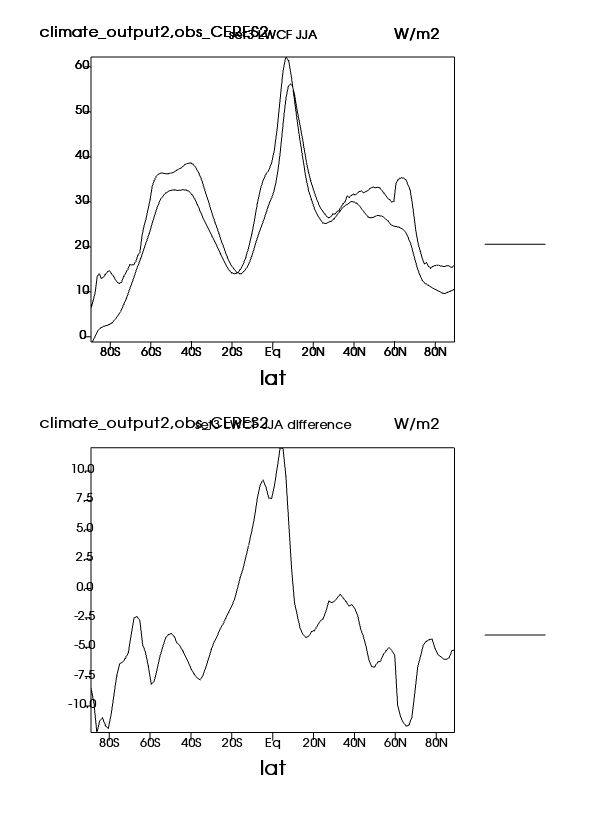
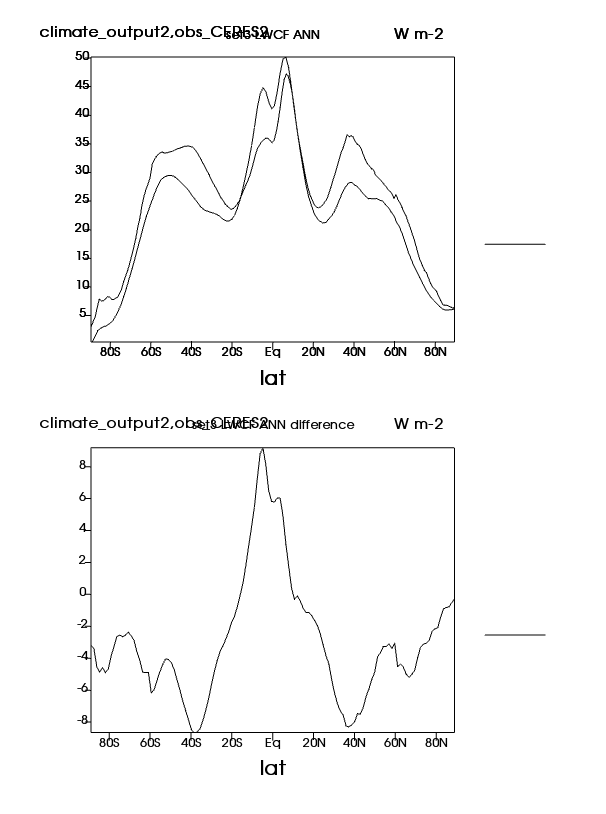
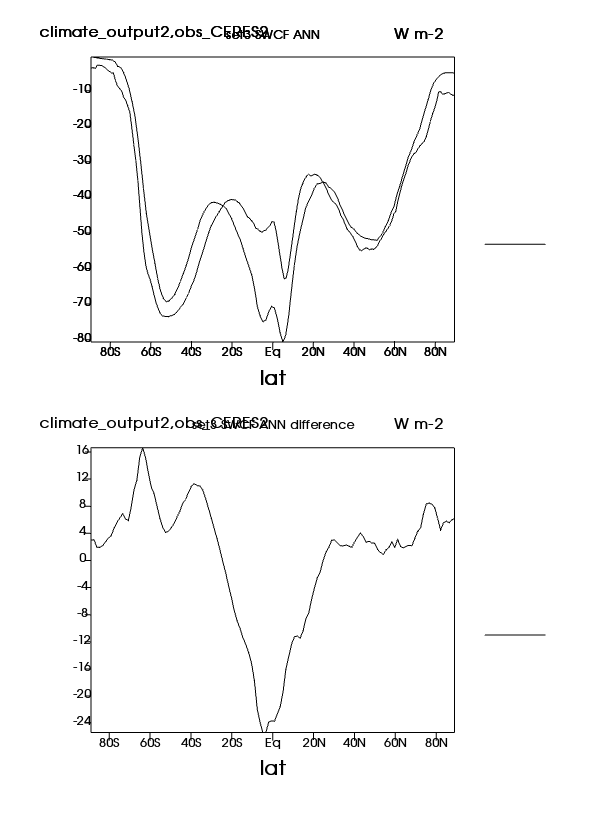
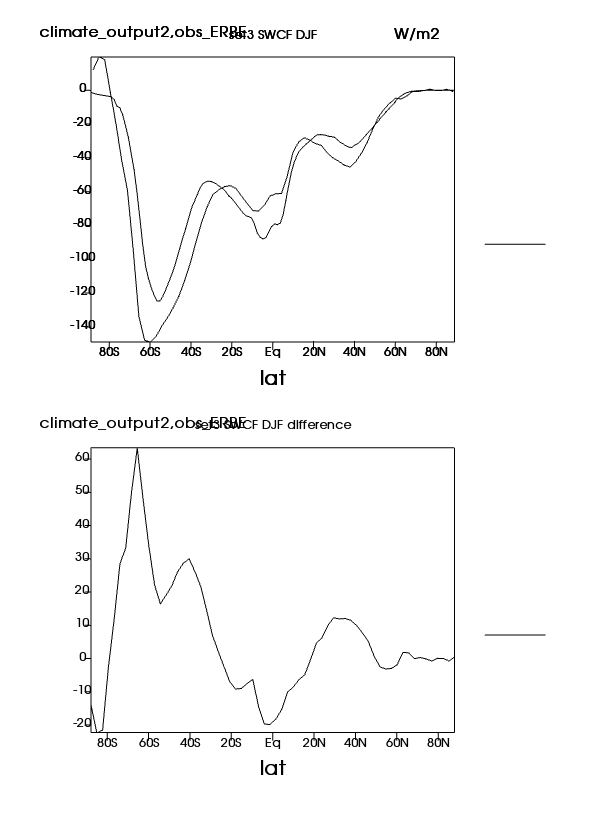
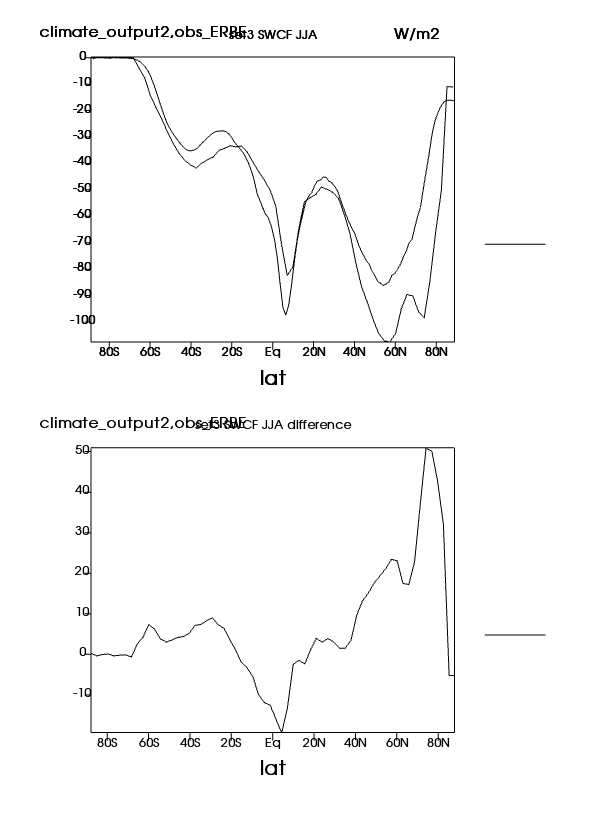
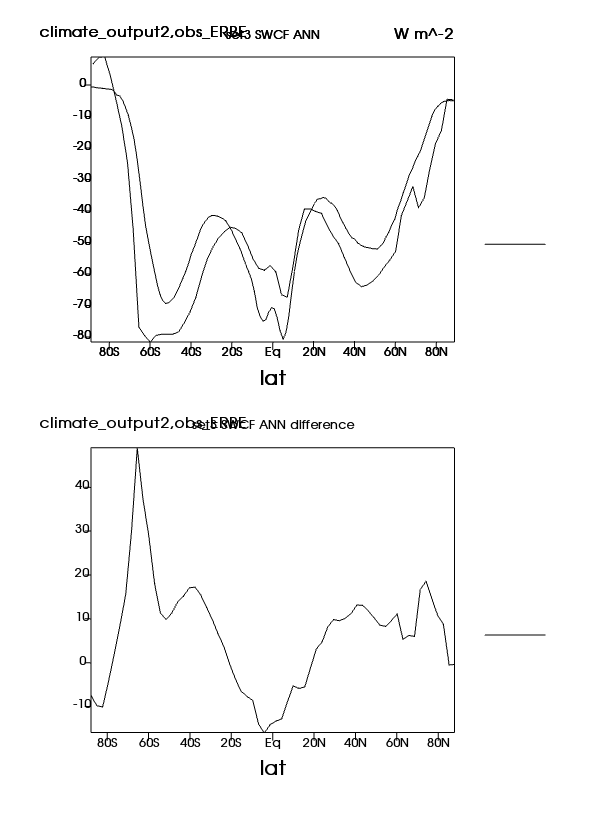
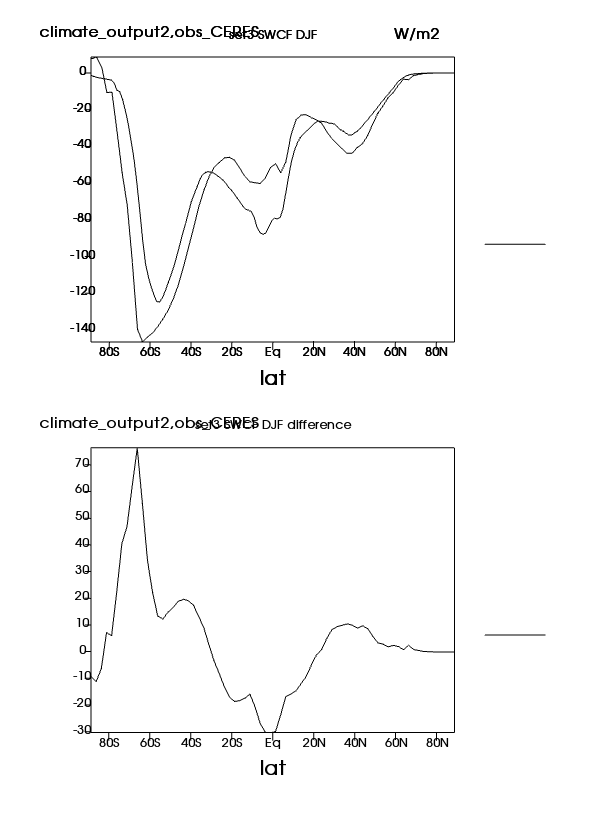
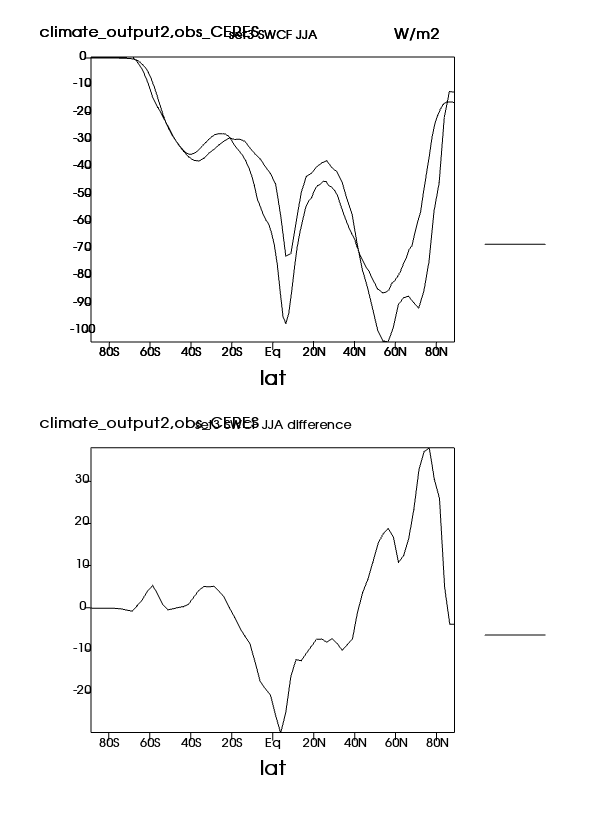
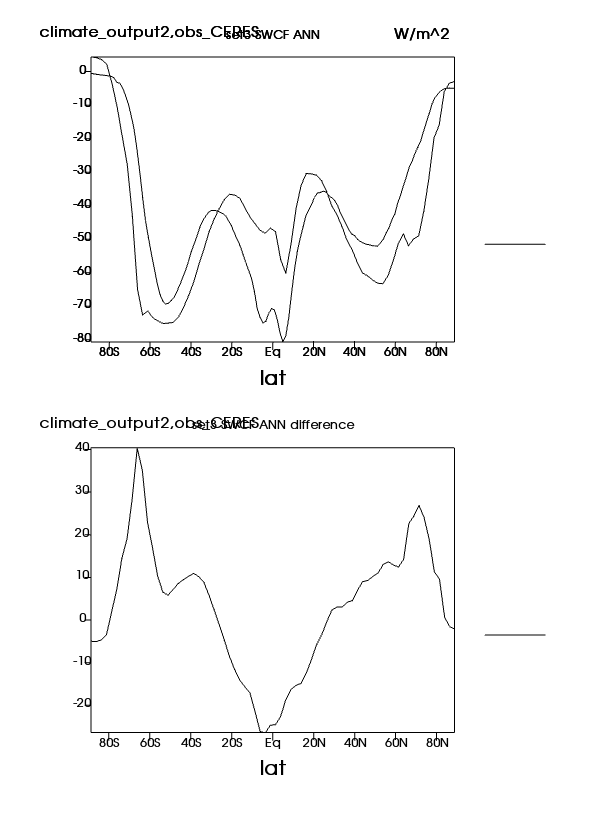
| SWCF | TOA shortwave cloud forcing | Plot | Plot | Plot |
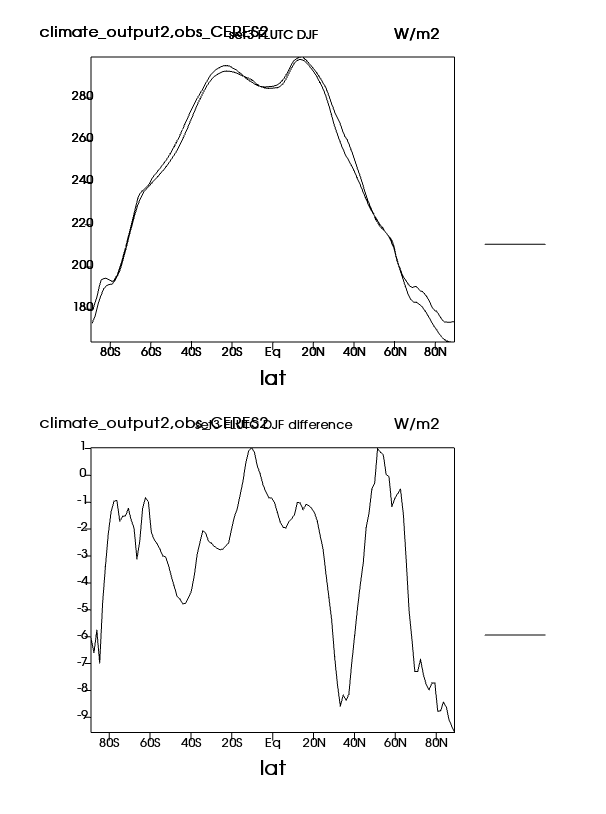
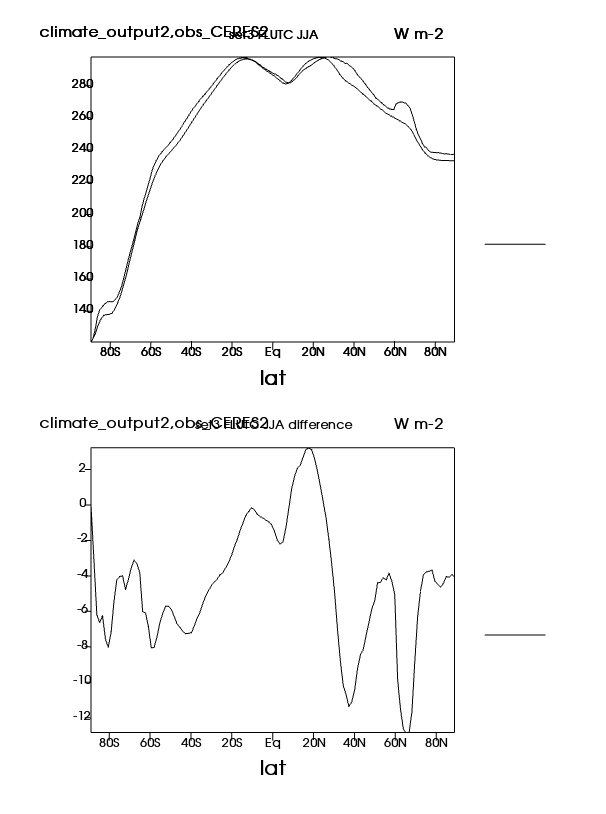
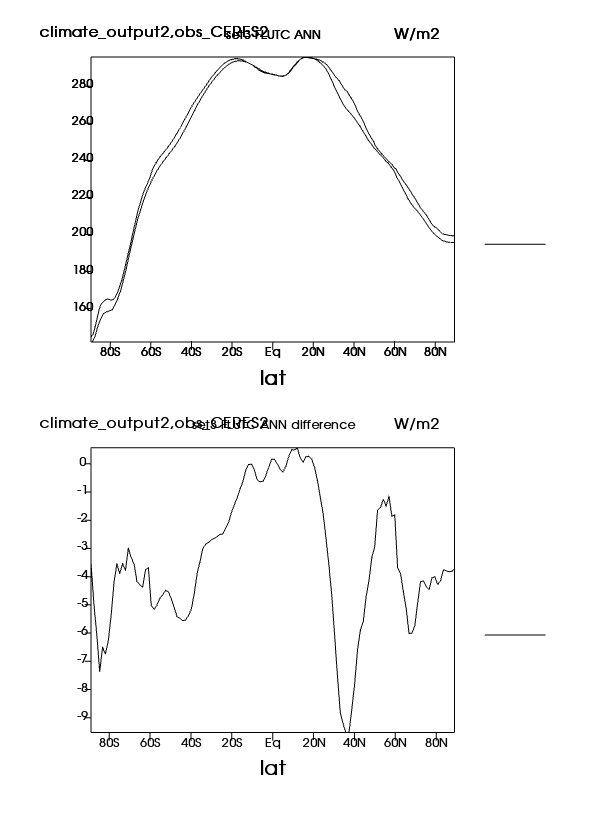
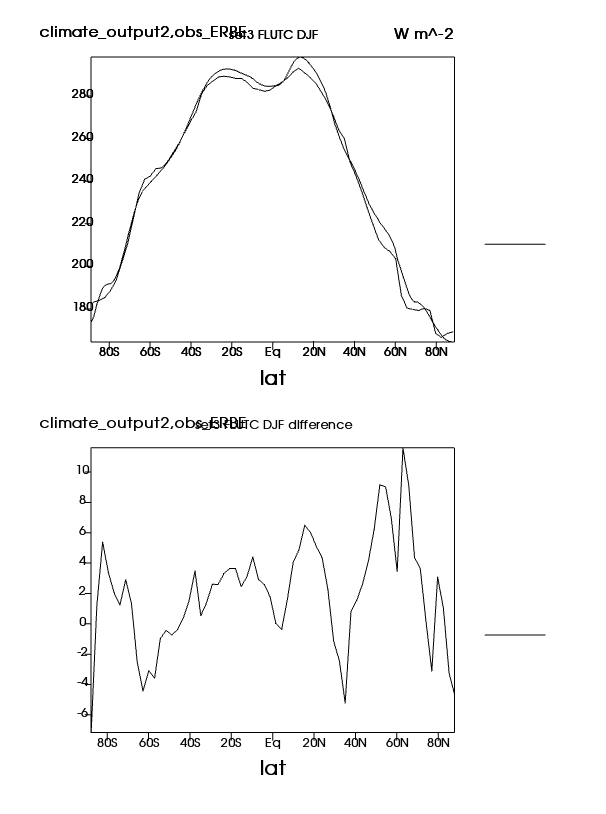
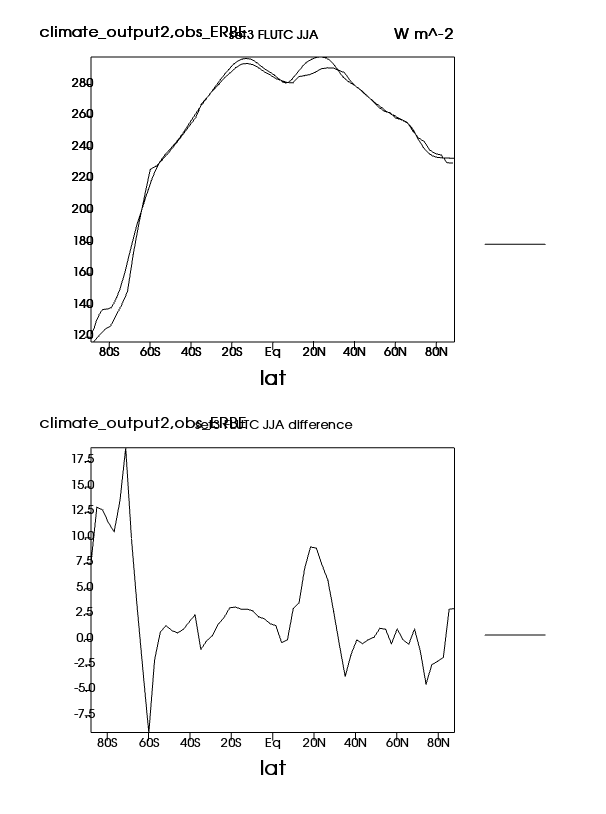
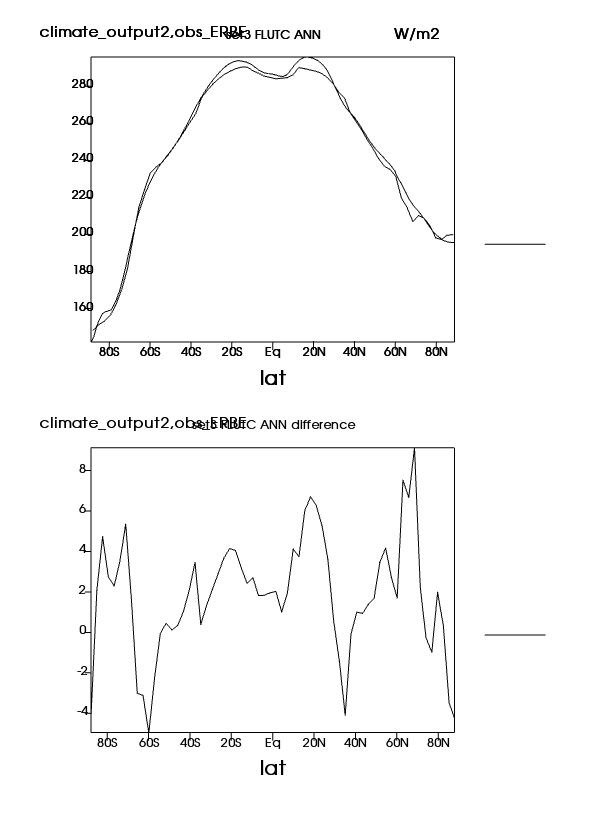
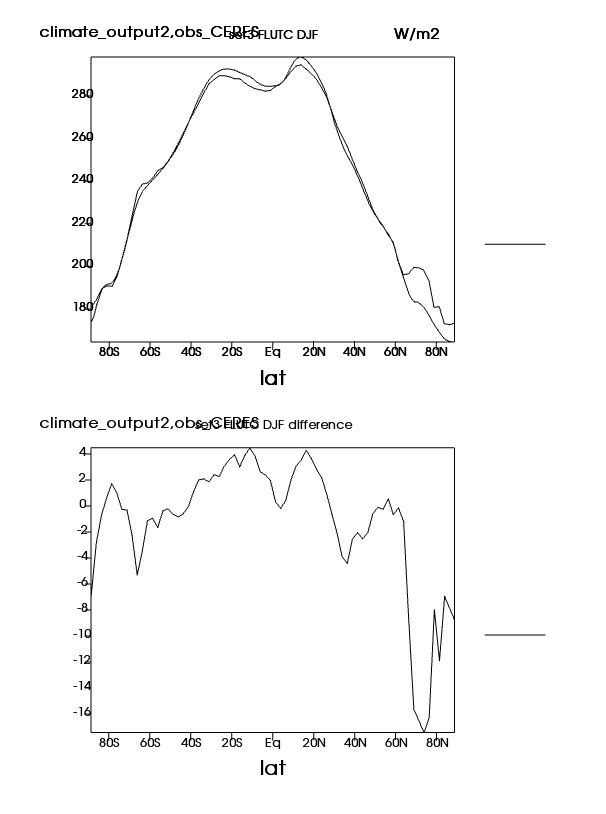
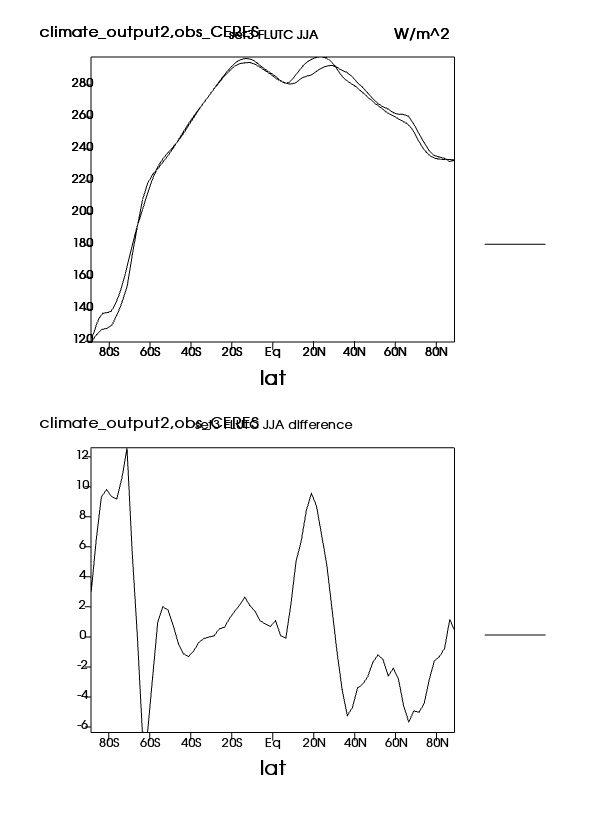
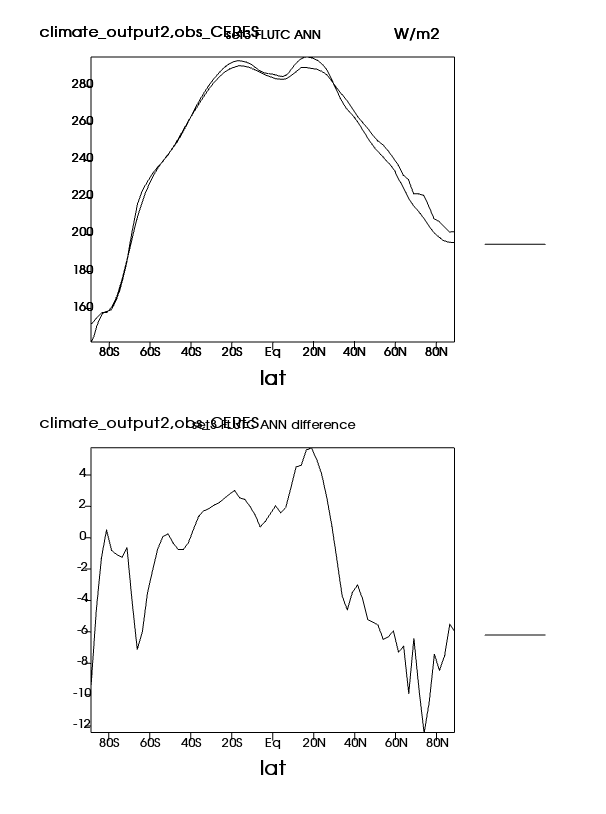
| FLUTC | TOA clearsky upward LW flux (Northern) | Plot | Plot | Plot |
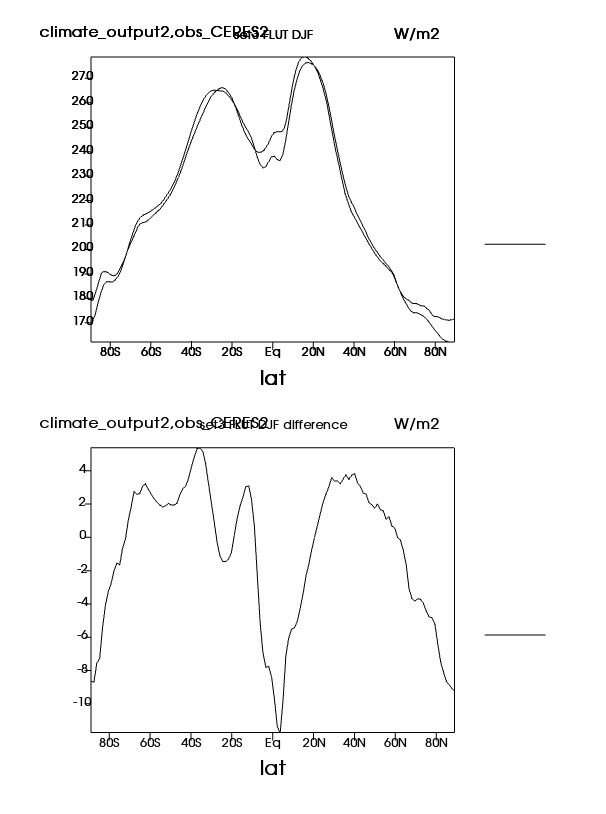
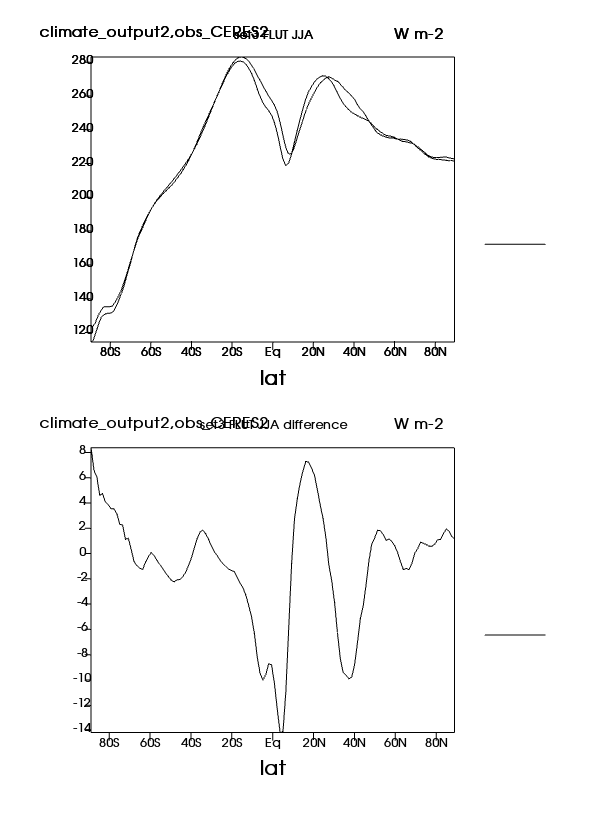
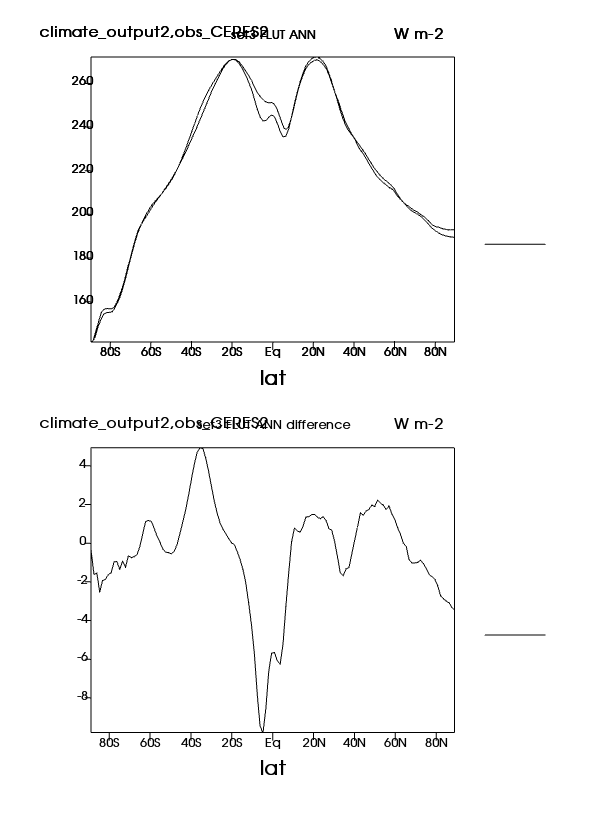
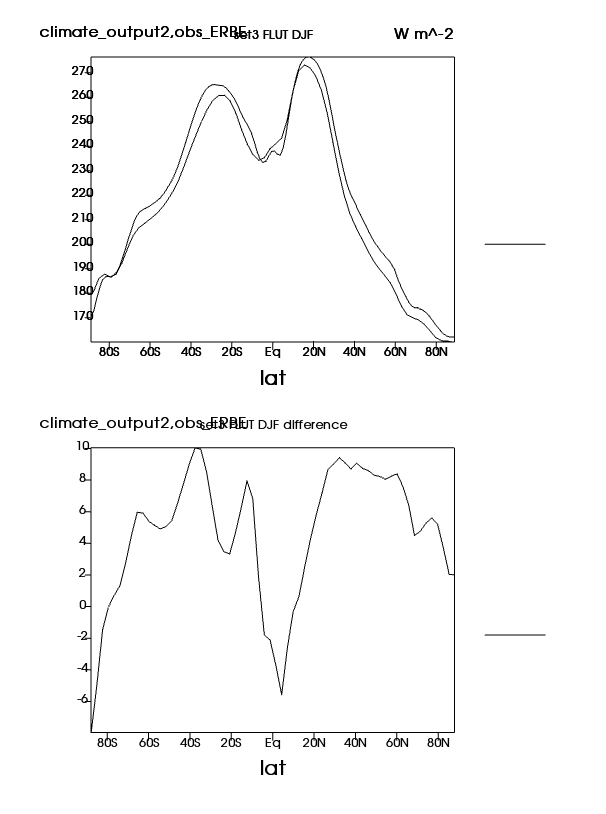
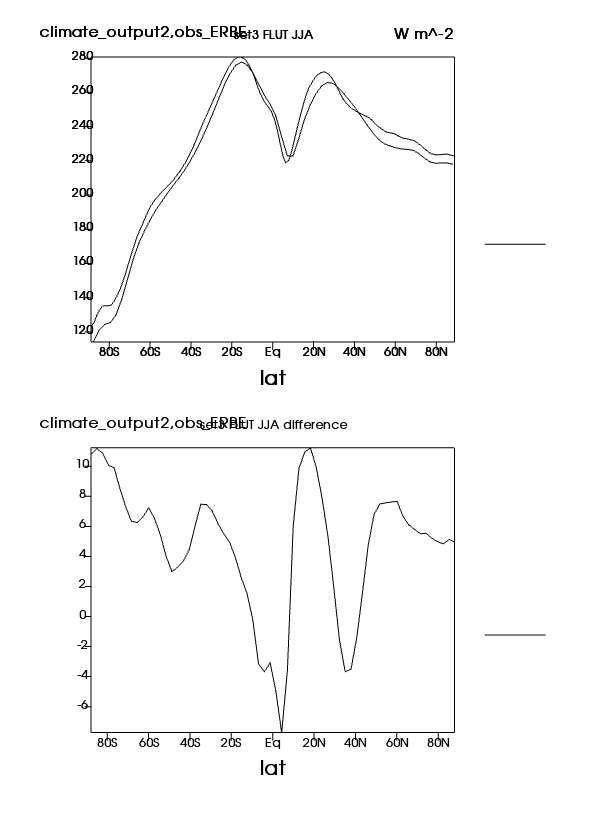
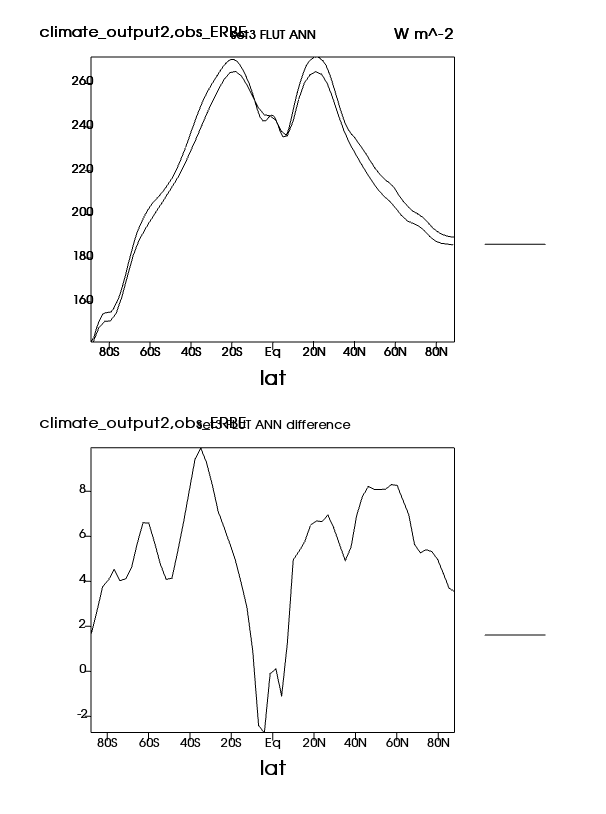
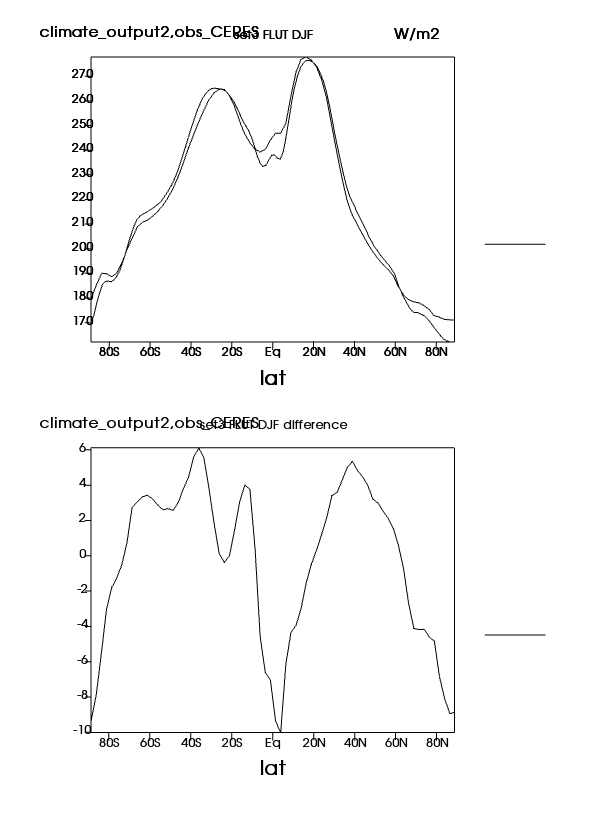
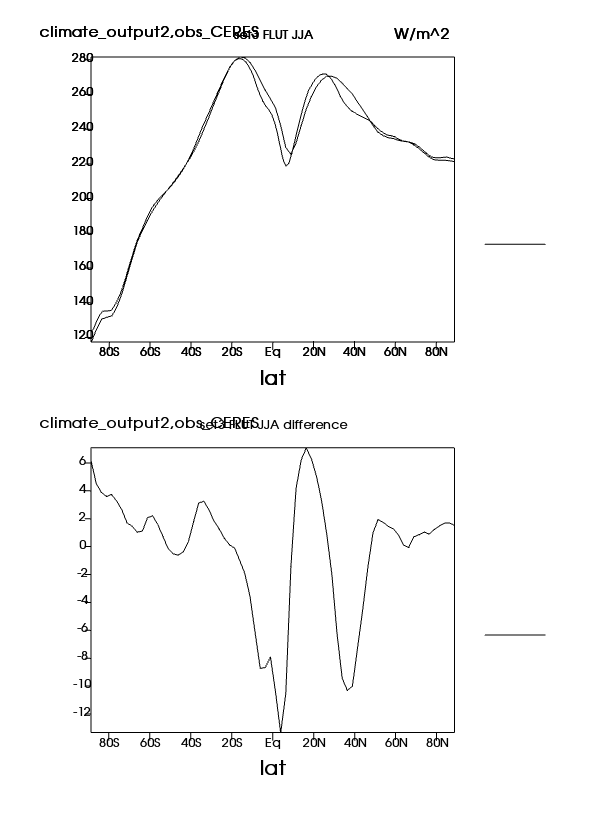
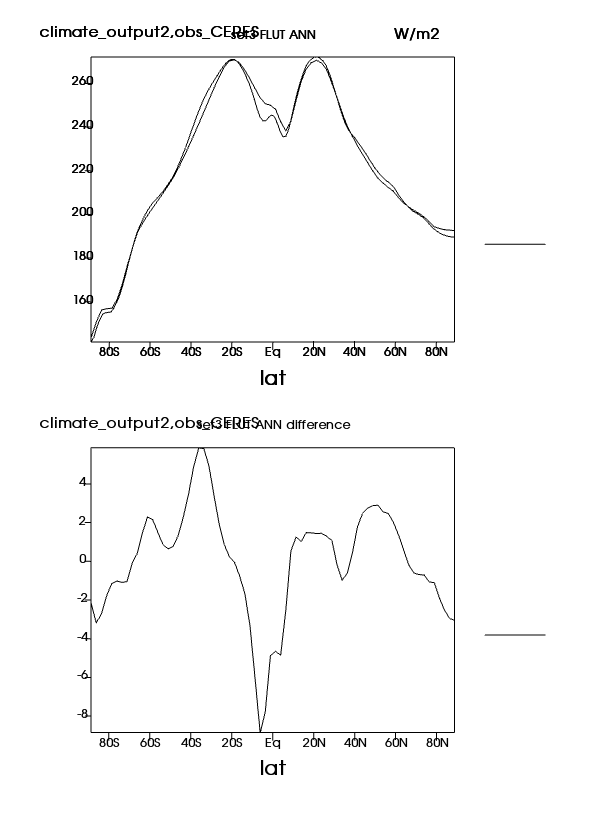
| FLUT | TOA upward LW flux (Northern) | Plot | Plot | Plot |
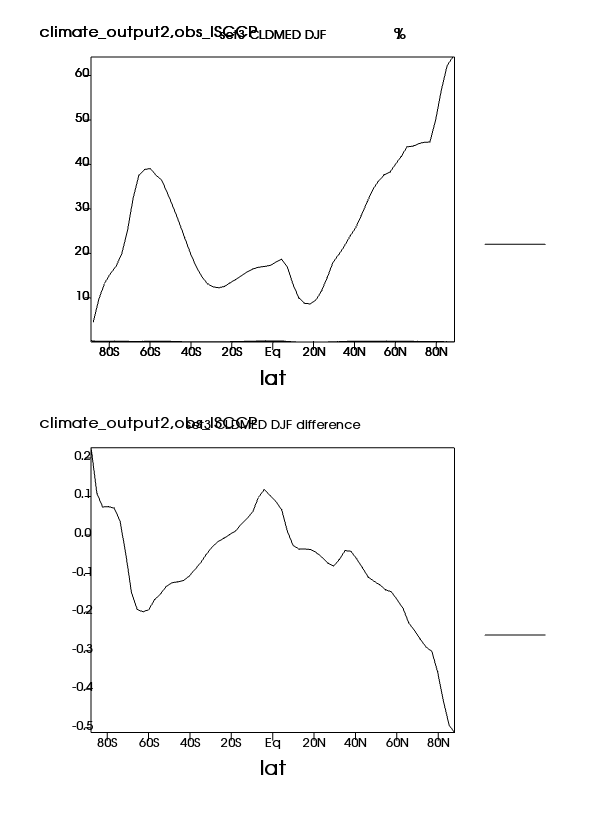
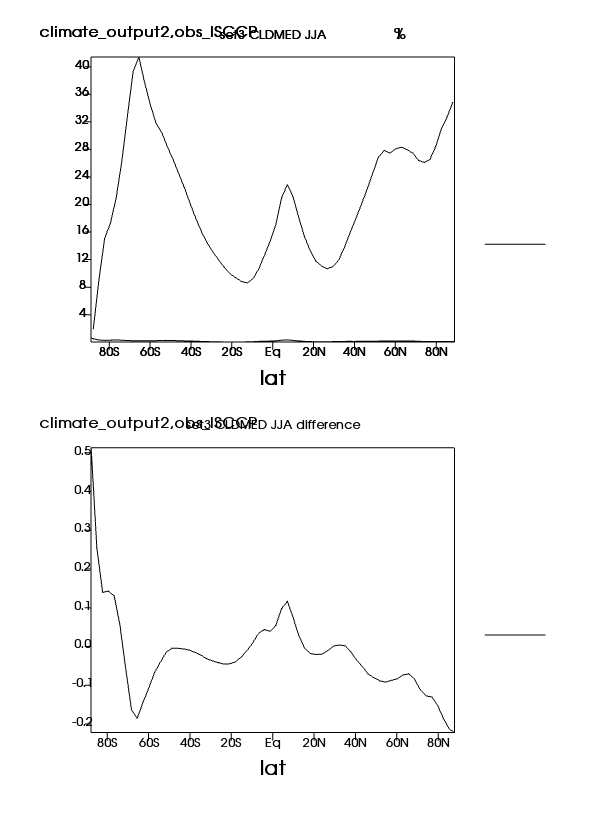
| CLDMED | Mid cloud amount (IR clouds) (Northern) | Plot | Plot | Plot |
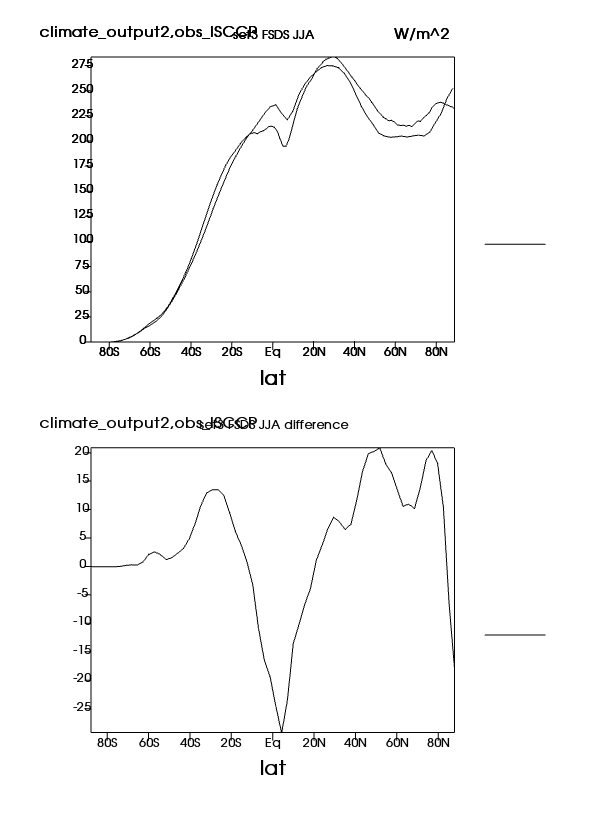
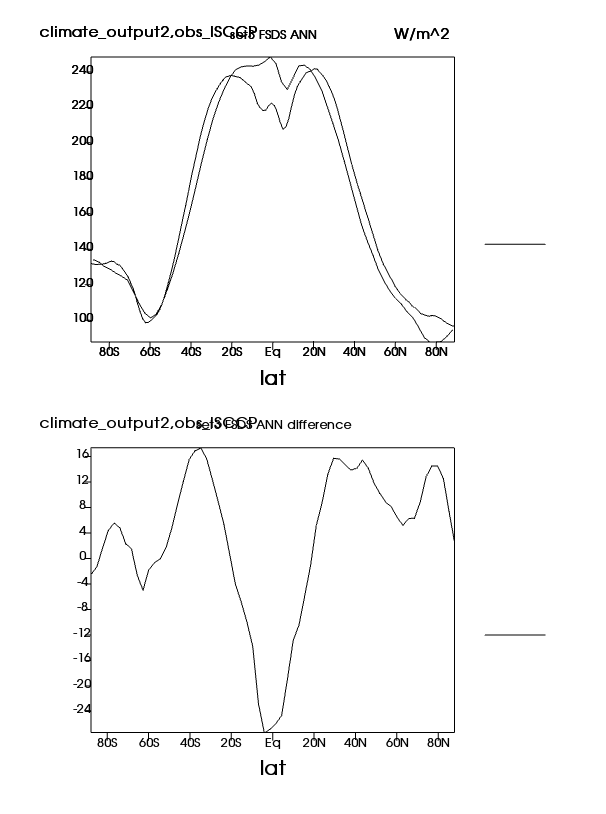
| FSDS | Surf SW downwelling flux (Northern) | Plot | Plot | Plot |
| CLDLOW | Low cloud amount (IR clouds) | Plot | Plot | Plot |
| SWCFSRF | Surf SW Cloud Forcing | Plot | Plot | Plot |
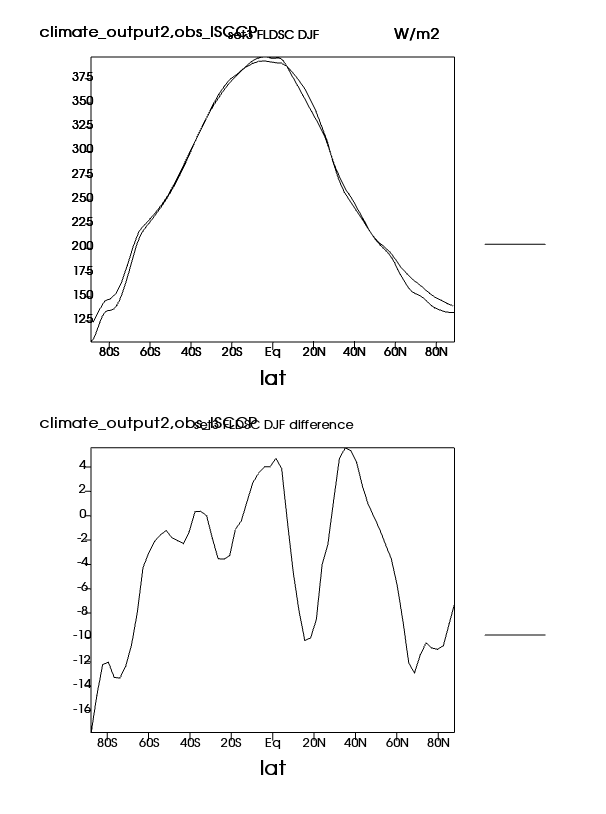
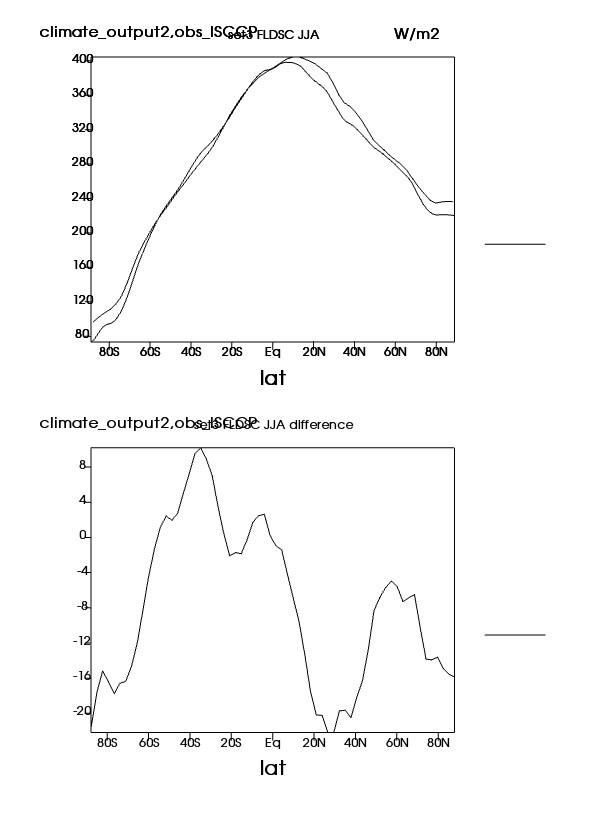
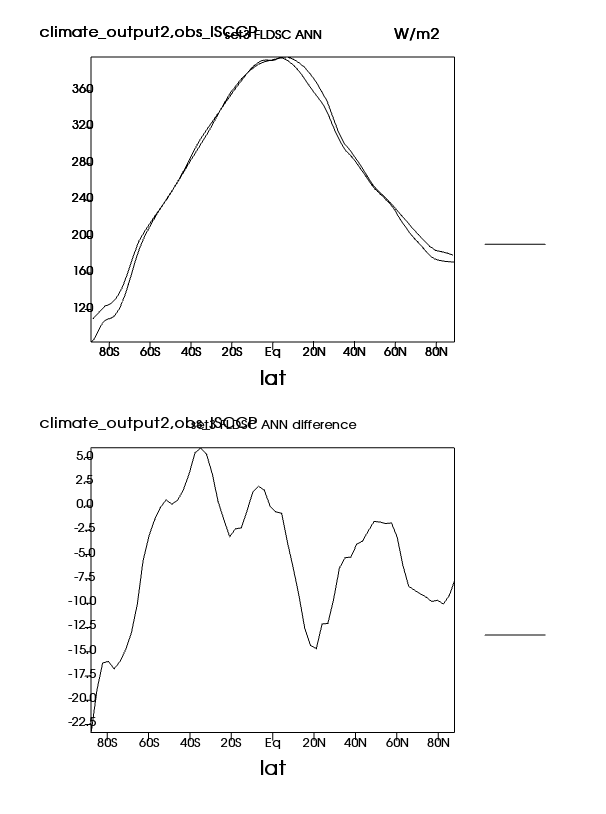
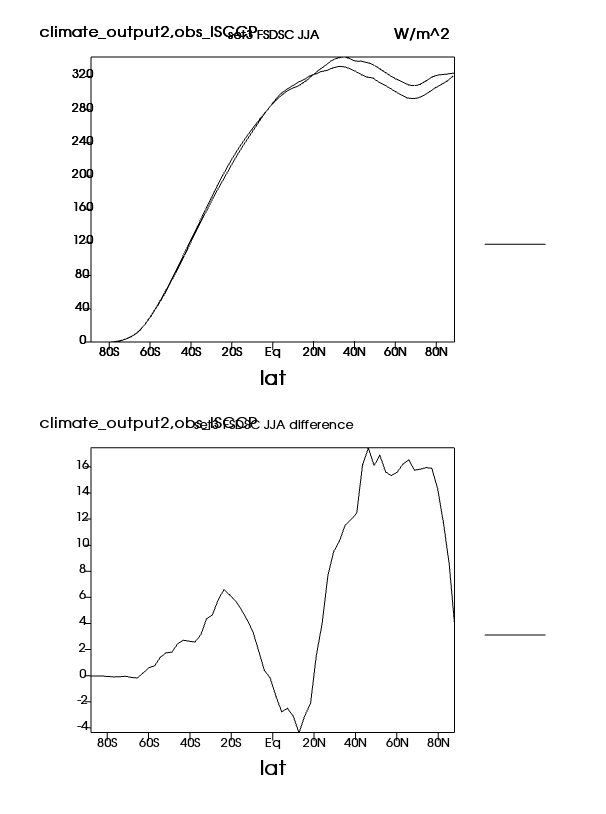
| FLDSC | Clearsky Surf LW downwelling flux | Plot | Plot | Plot |
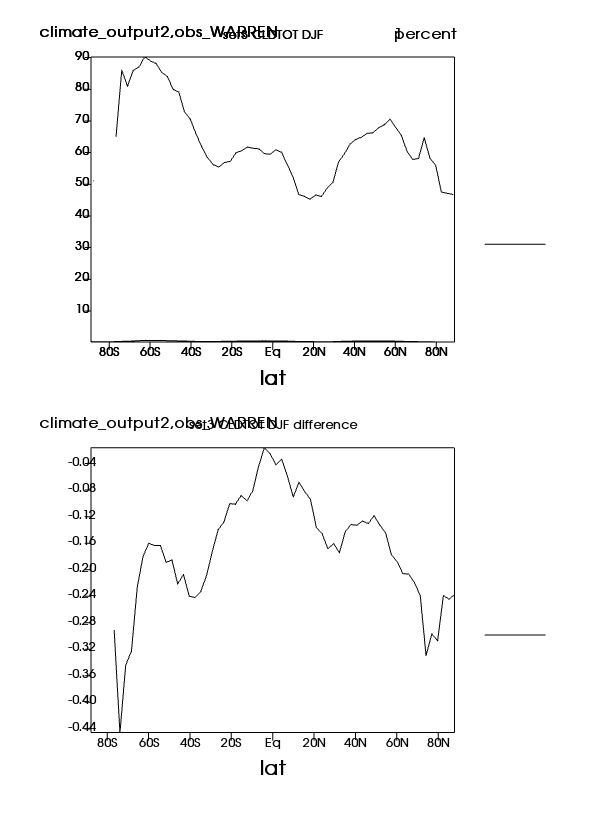
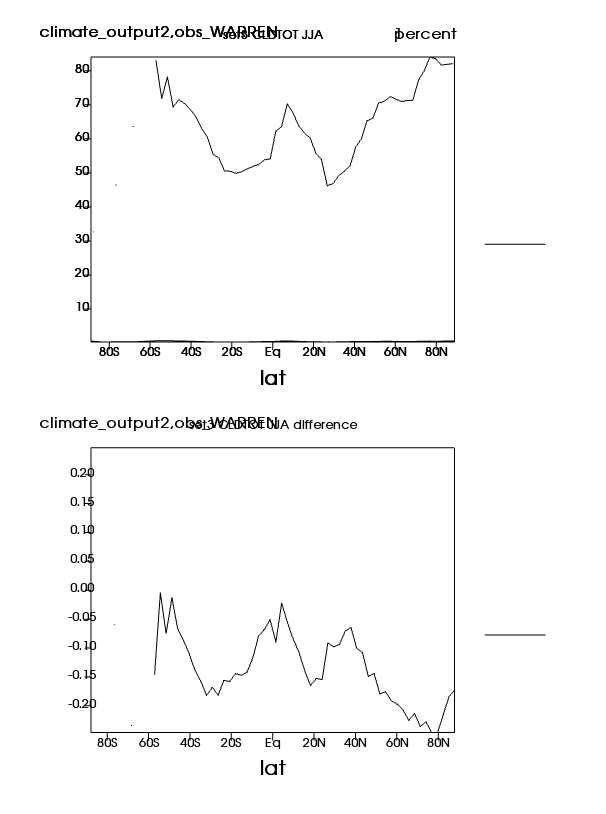
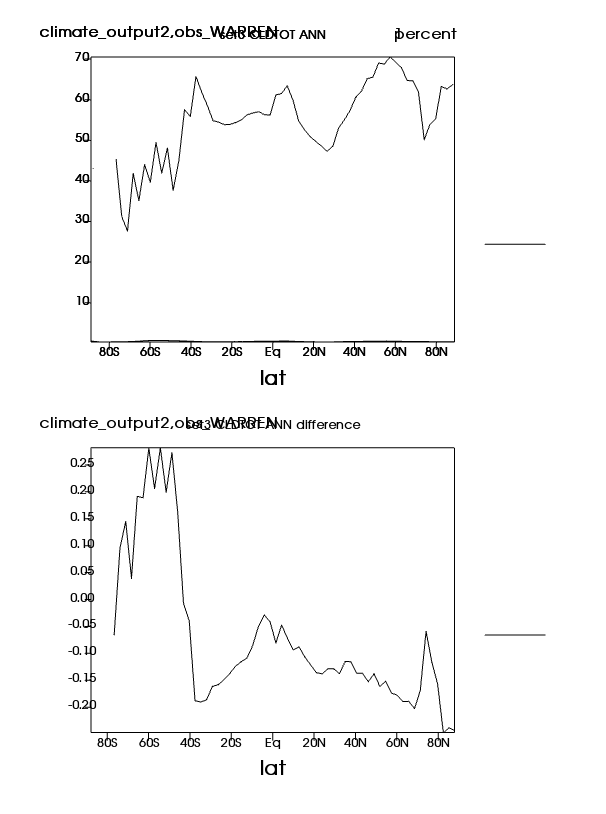
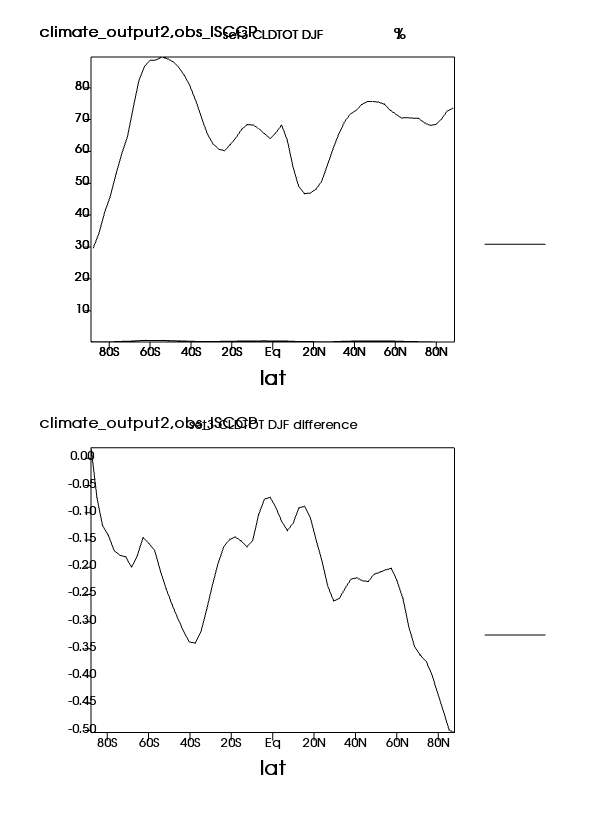
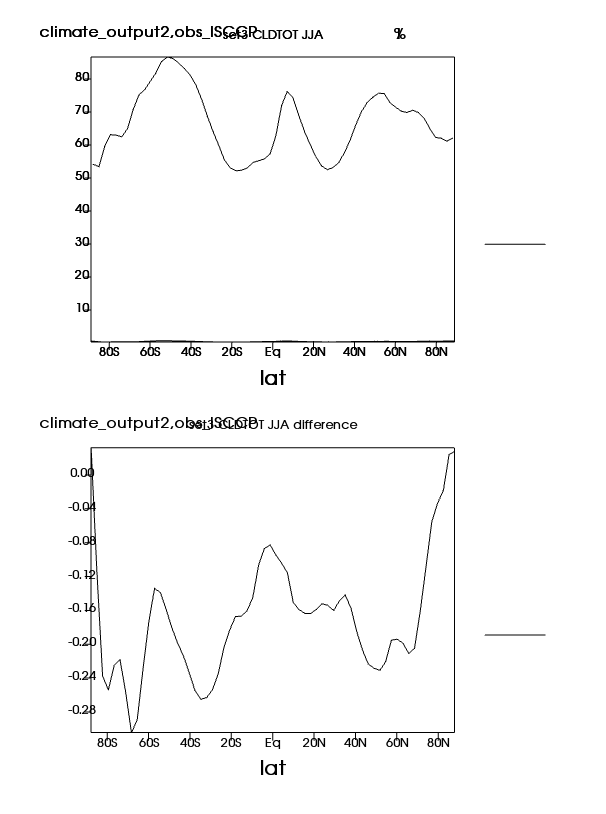
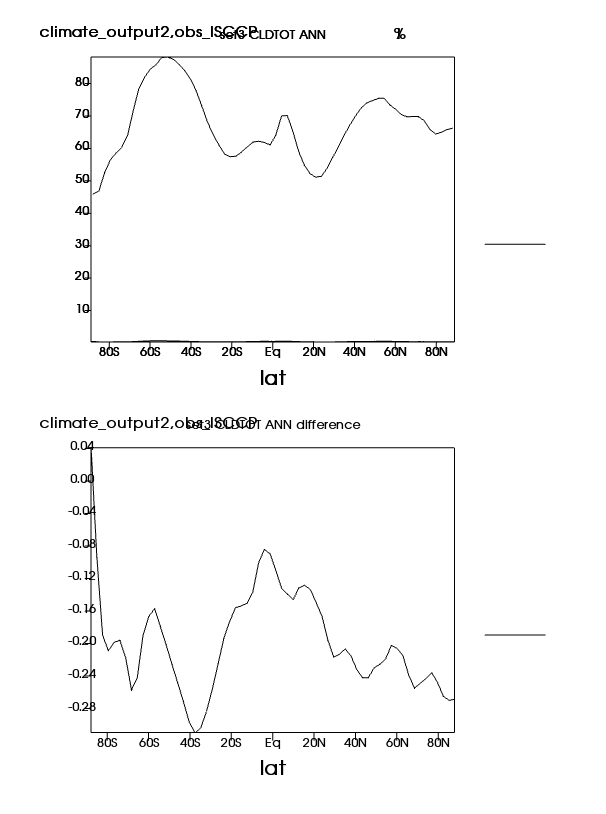
| CLDTOT | Mid cloud amount (IR clouds) | Plot | Plot | Plot |
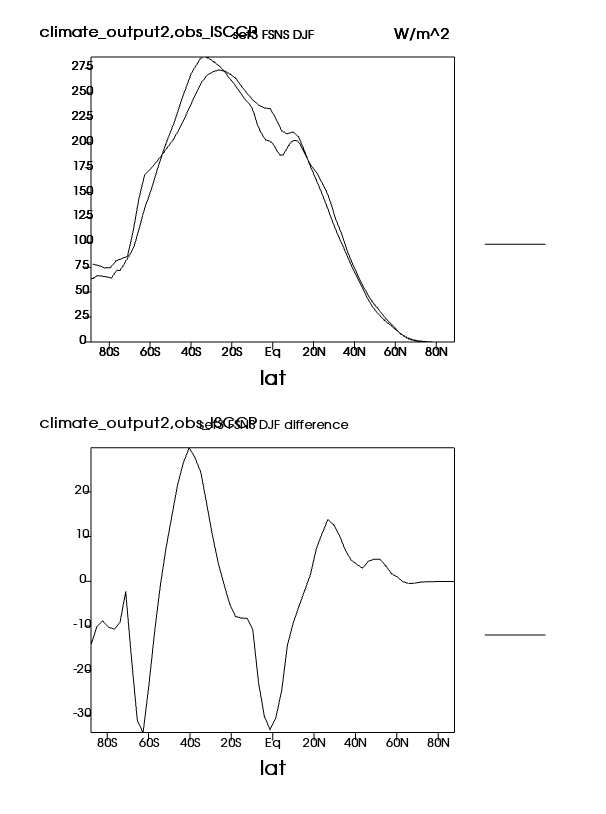
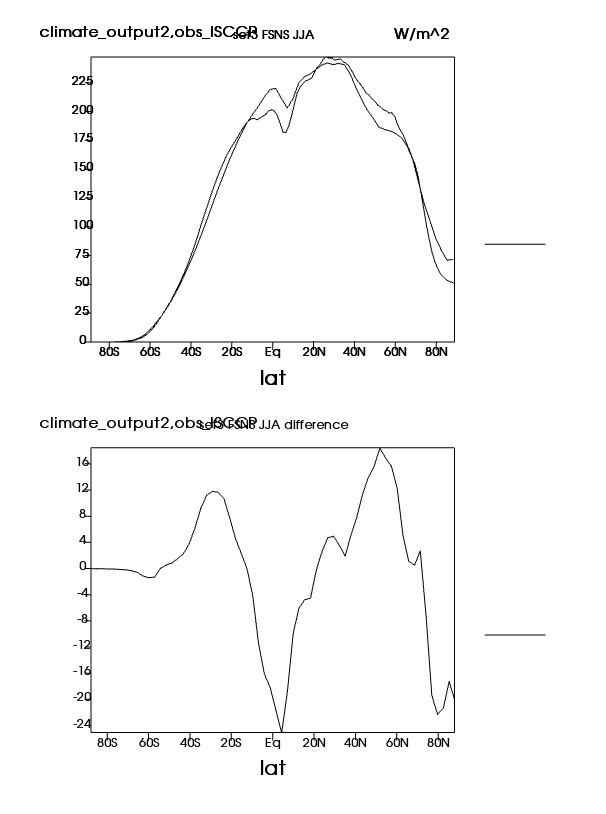
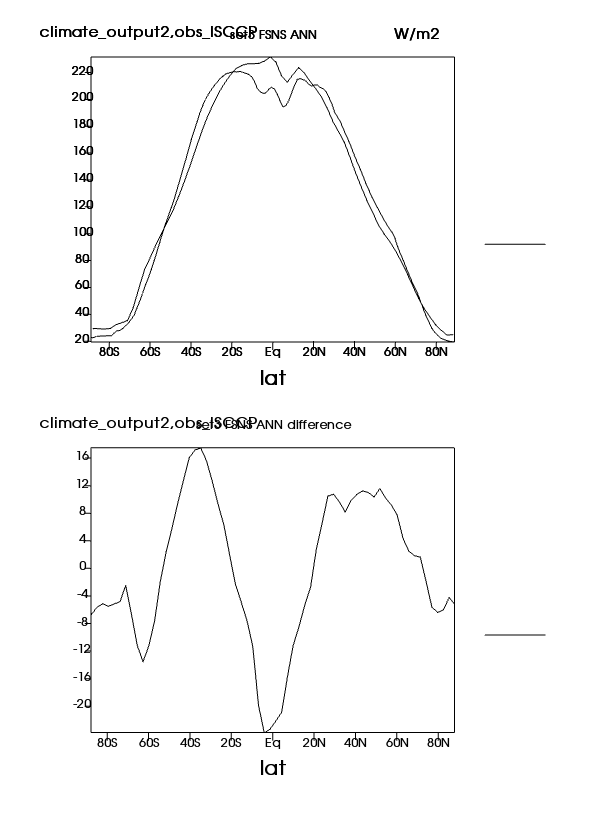
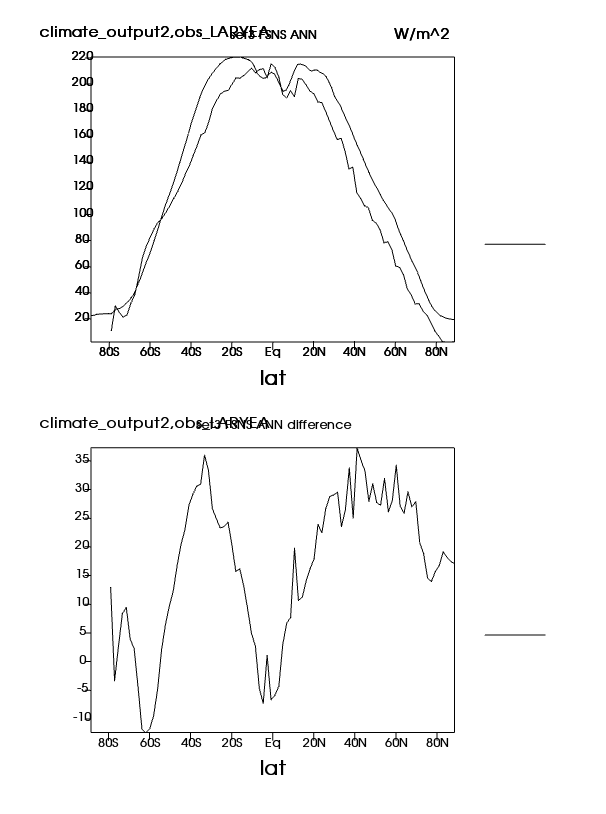
| FSNS | Surf Net SW flux (Northern) | Plot | Plot | Plot |
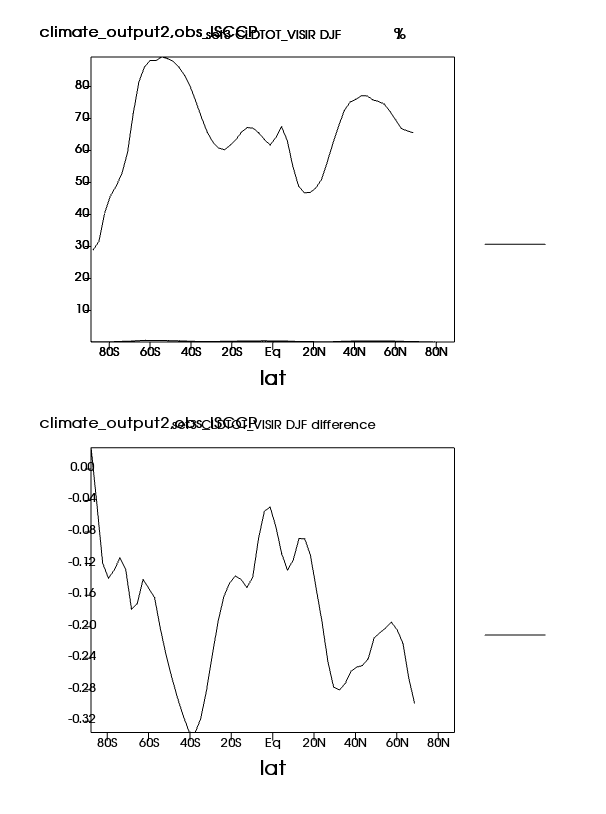
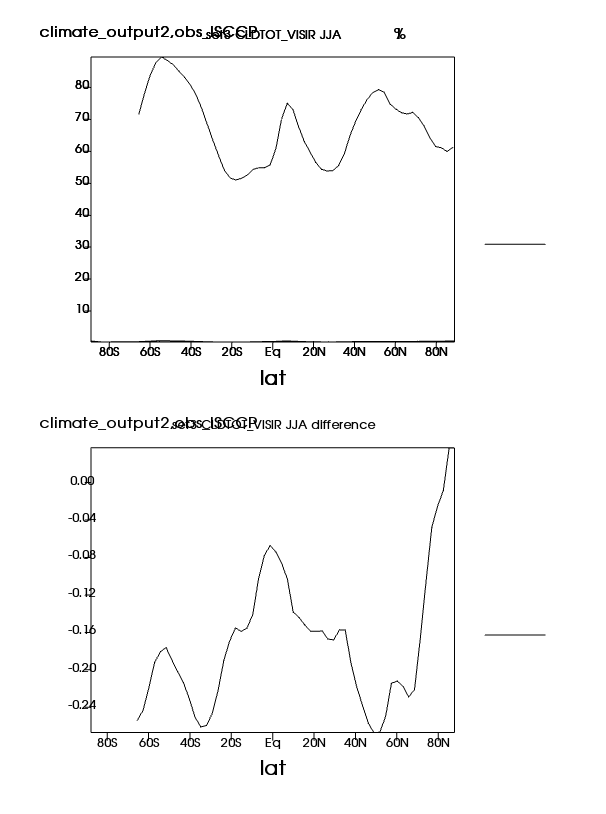
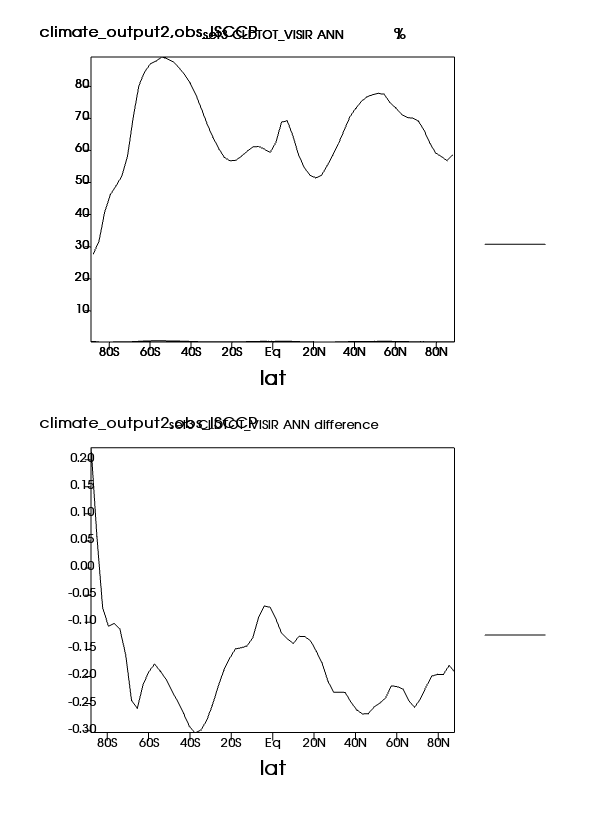
| CLDTOT_VISIR | Total cloud amount (VIS/IR/NIR clouds) | Plot | Plot | Plot |
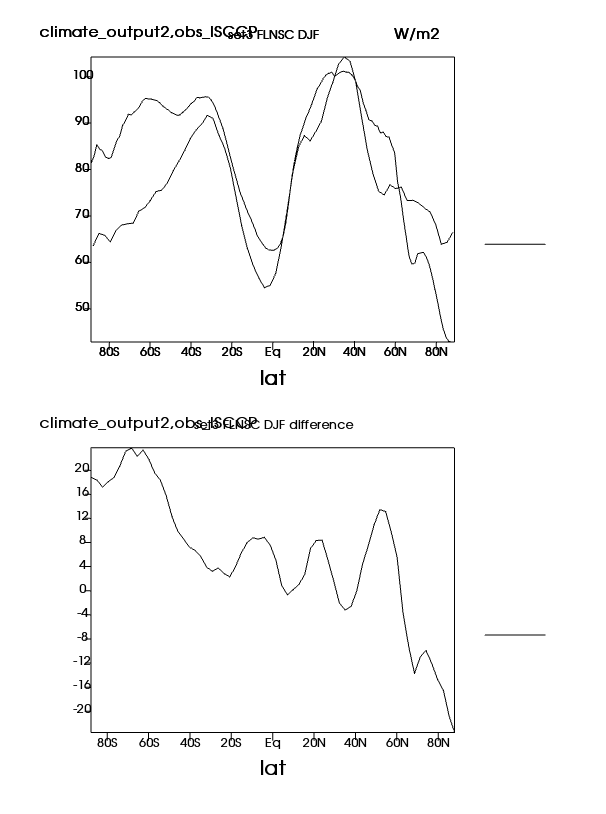
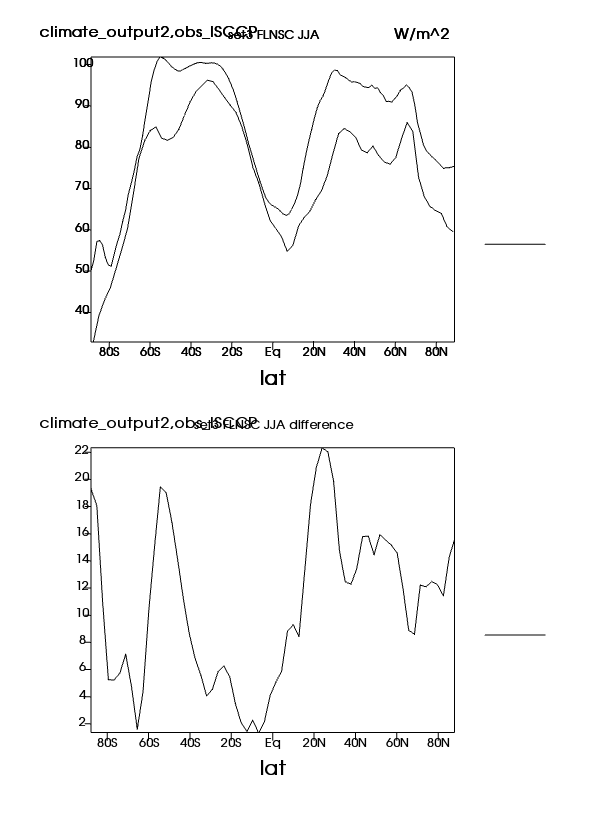
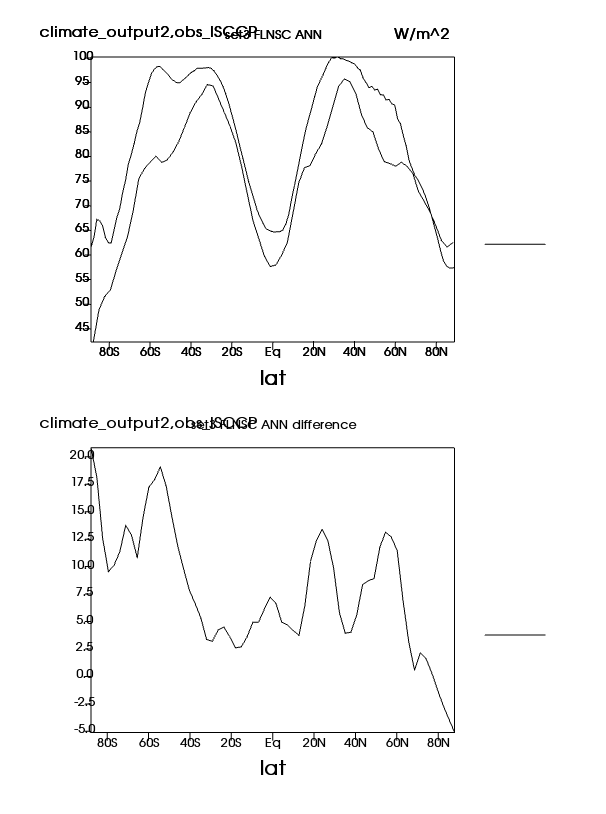
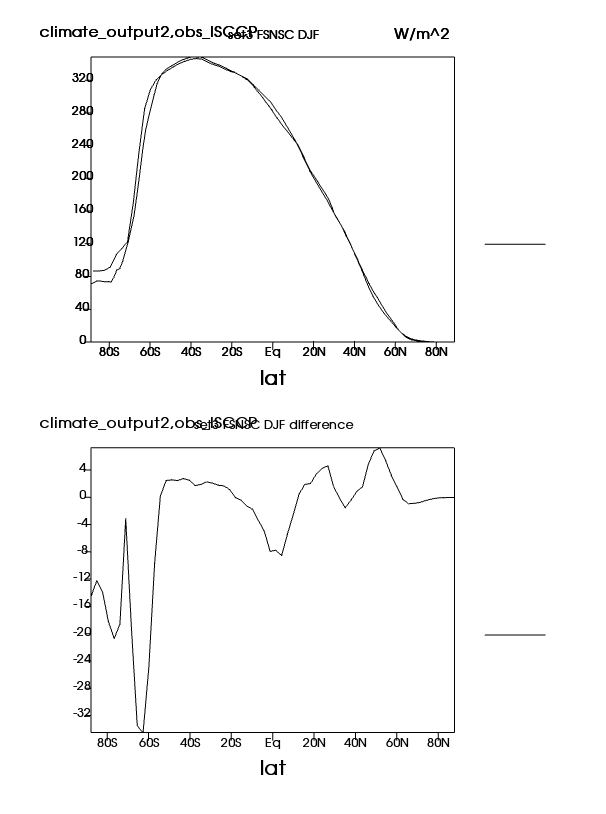
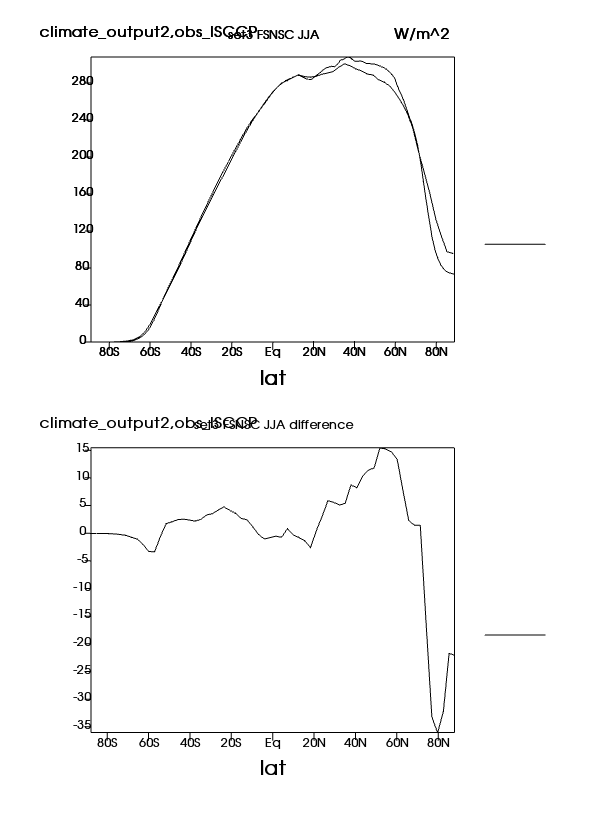
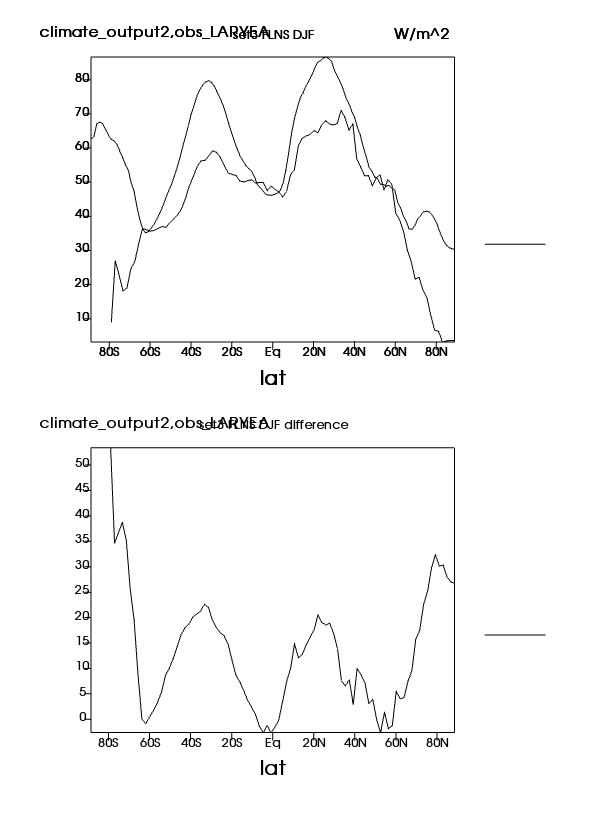
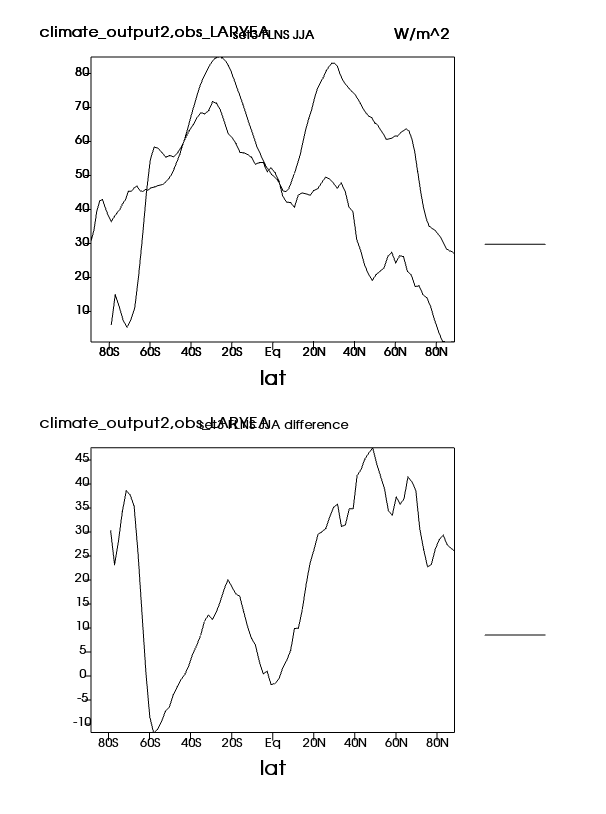
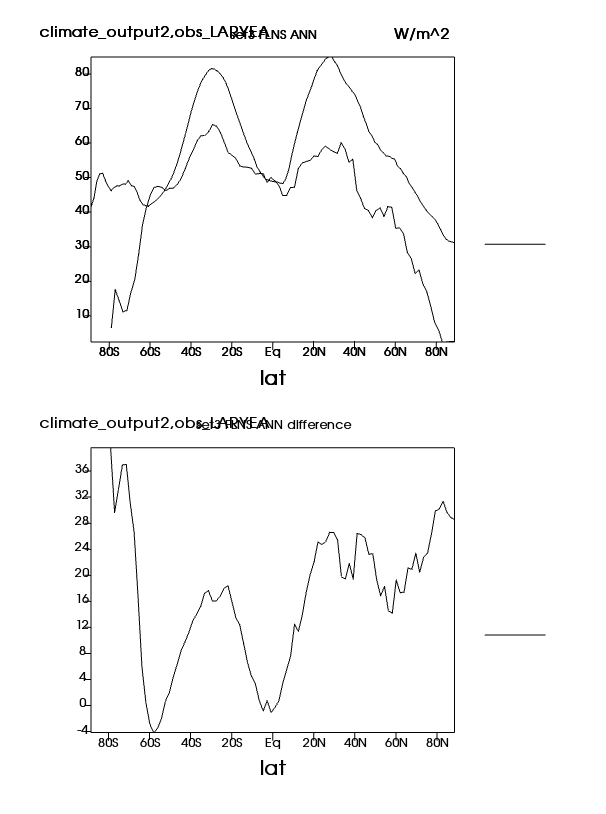
| FLNSC | Clearsky Surf Net LW flux (Northern) | Plot | Plot | Plot |
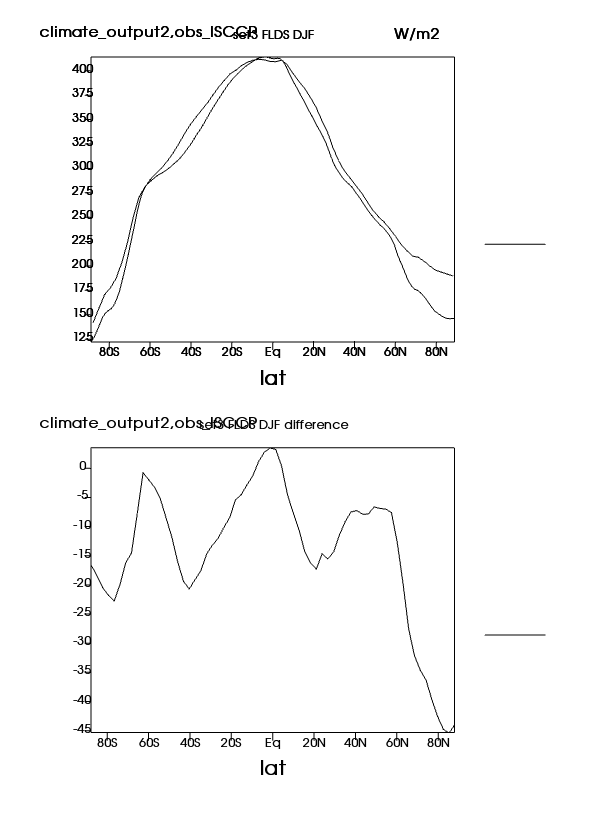
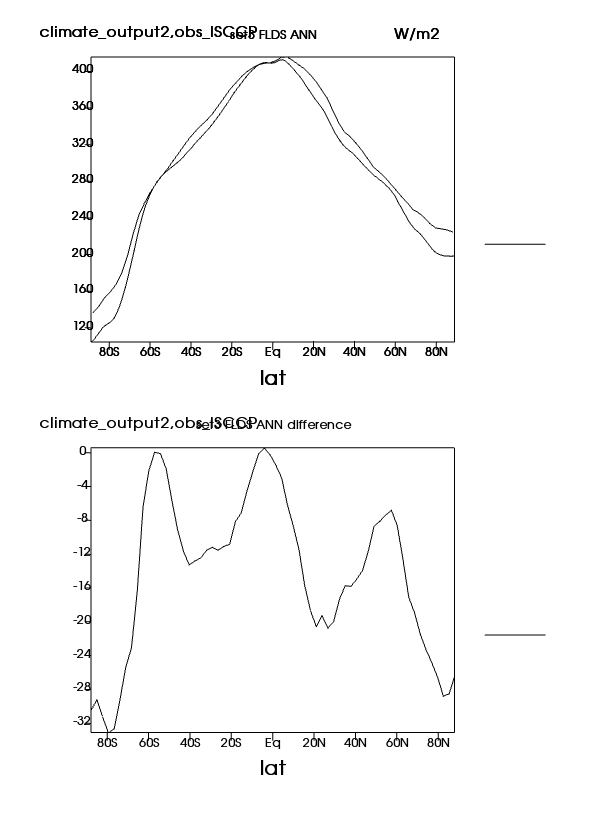
| FLDS | Surf LW downwelling flux | Plot | Plot | Plot |
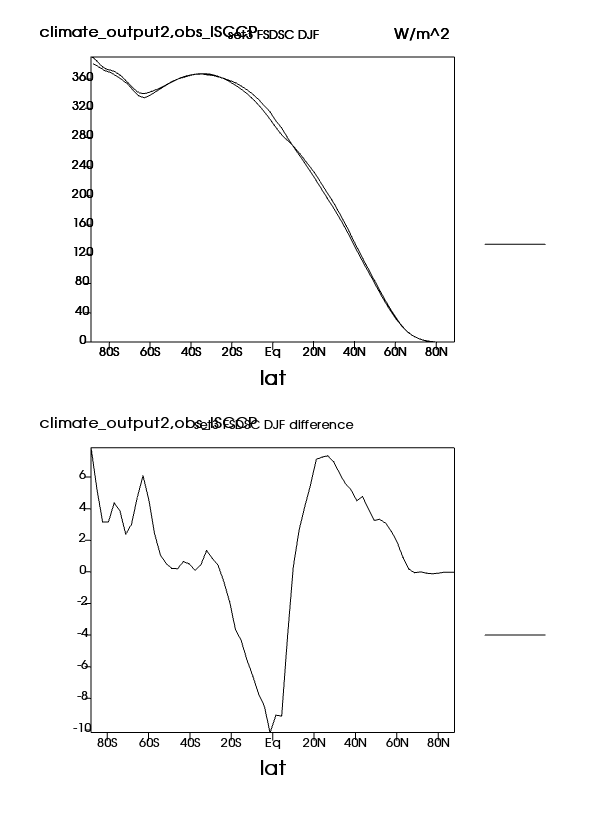
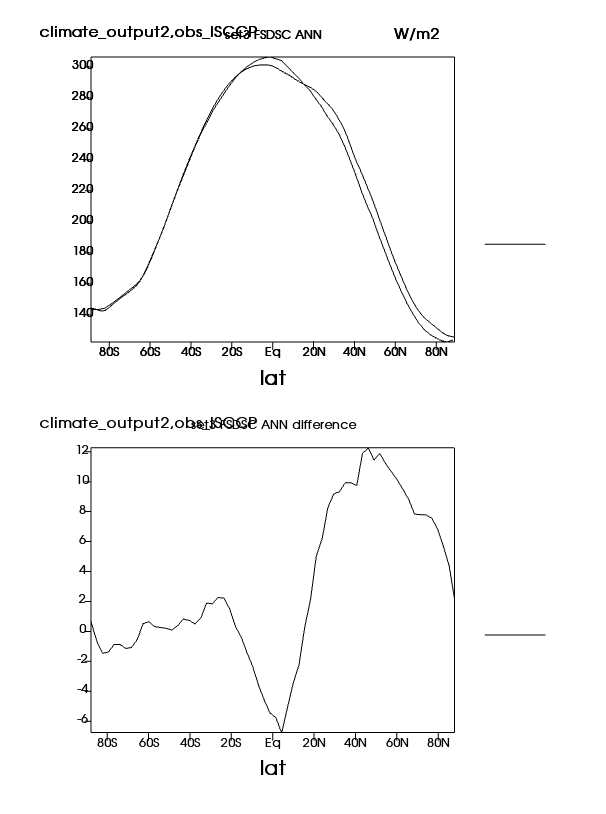
| FSDSC | Clearsky Surf SW downwelling flux (Northern) | Plot | Plot | Plot |
| LWCFSRF | Surf LW Cloud Forcing | Plot | Plot | Plot |
| FSNSC | Clearsky Surf Net SW Flux | Plot | Plot | Plot |
| CLDHGH_VISIR | High cloud amount (VIS/IR/NIR) clouds) (Northern) | Plot | Plot | Plot |
| CLDHGH | High cloud amount (IR clouds) | Plot | Plot | Plot |
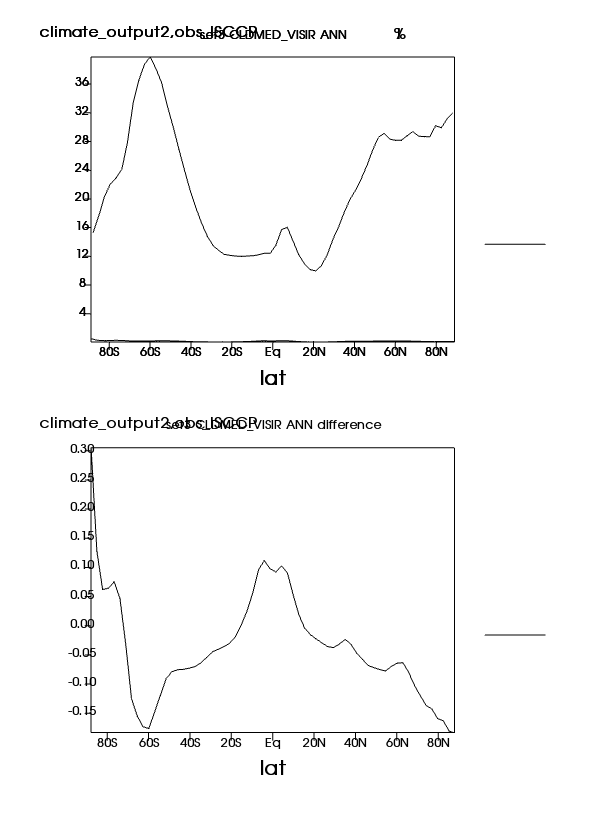
| CLDMED_VISIR | Mid cloud amount (VIS/IR/NIR clouds) | Plot | Plot | Plot |
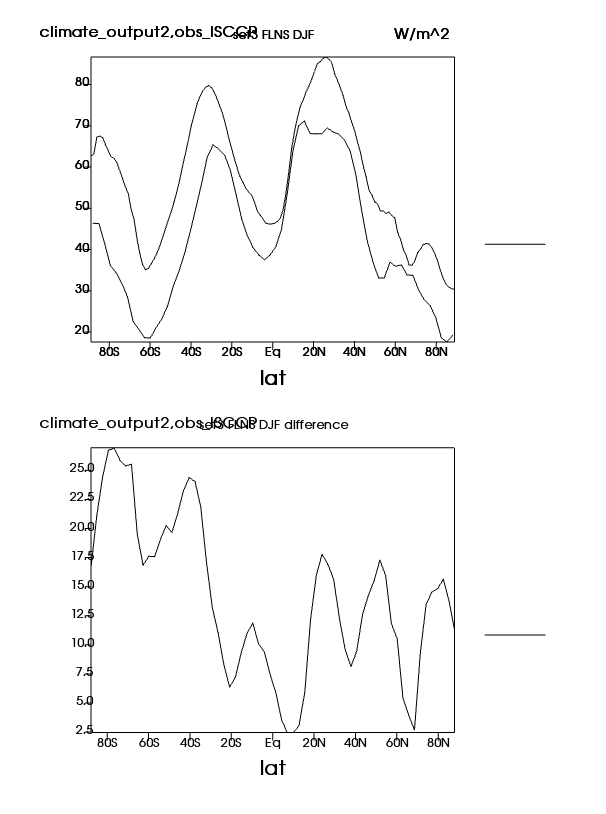
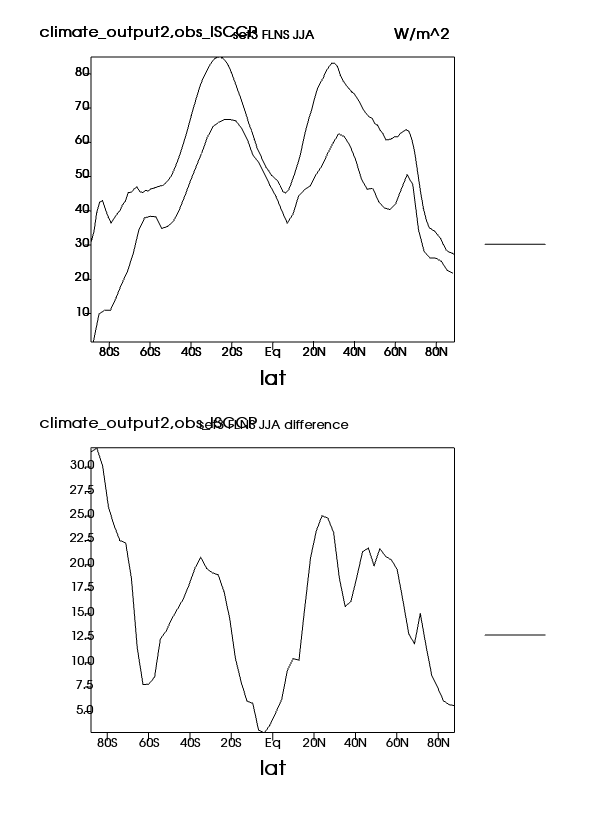
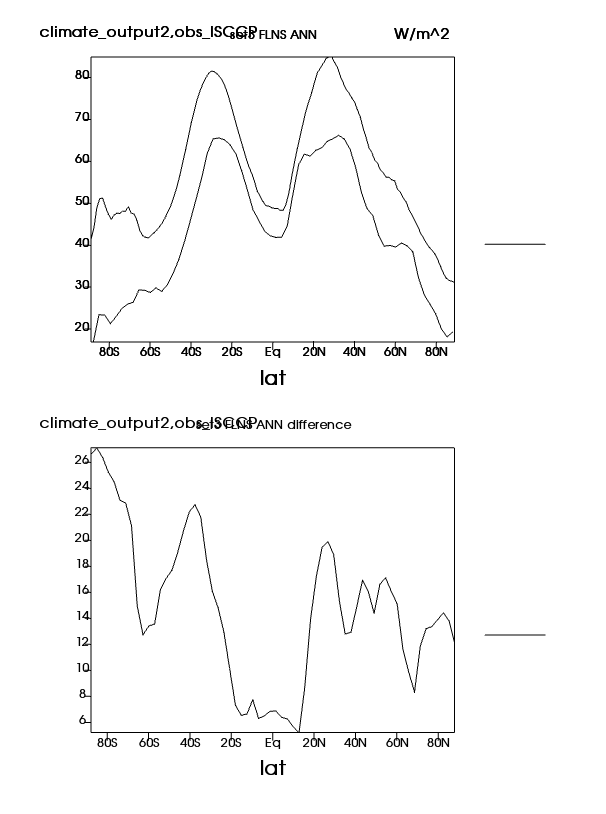
| FLNS | Surf Net LW flux (Northern) | Plot | Plot | Plot |
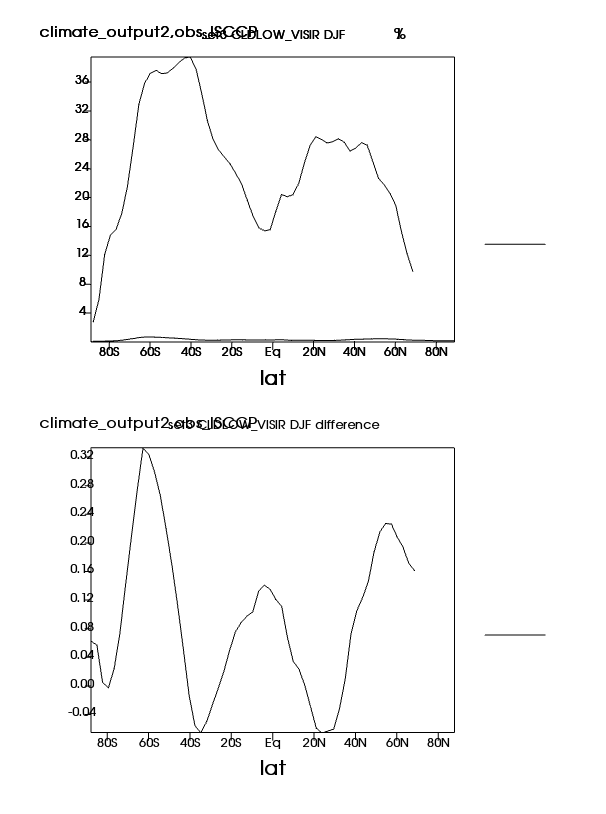
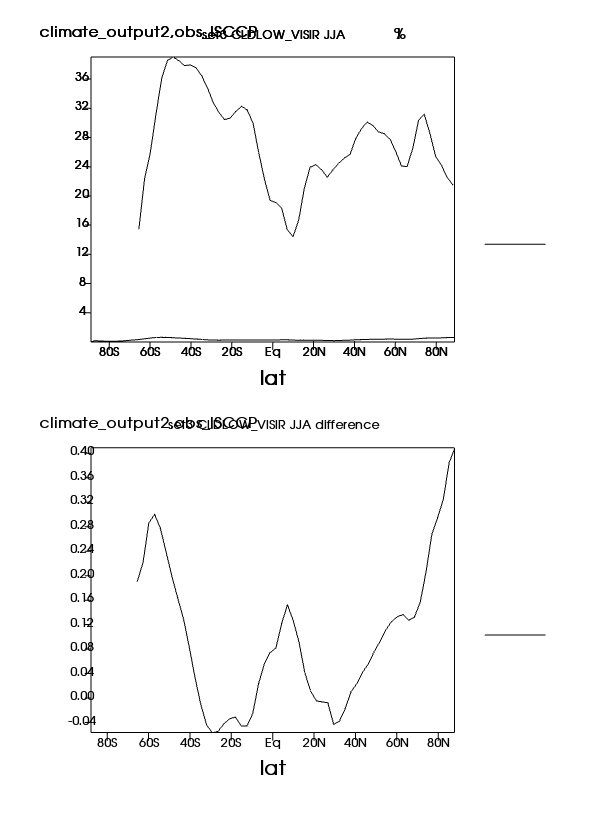
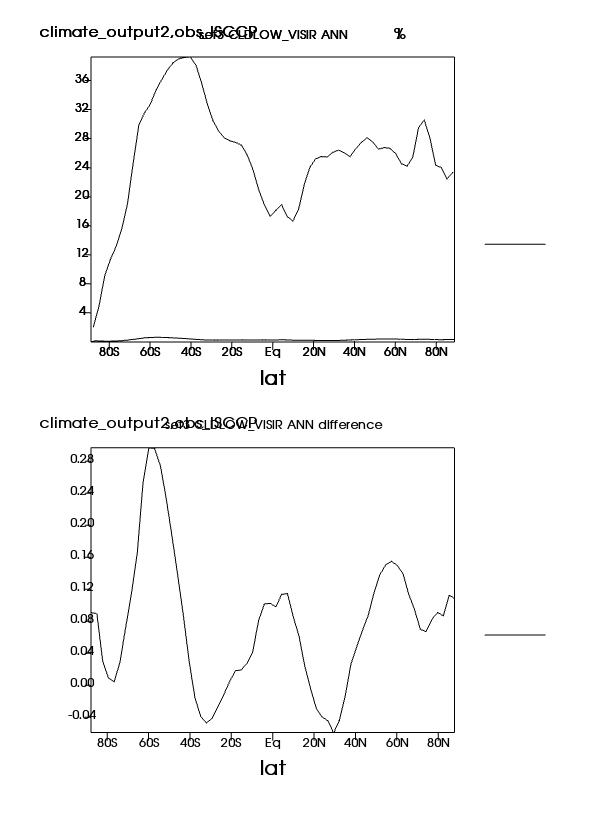
| CLDLOW_VISIR | Low cloud amount (VIS/IR/NIR) clouds) (Northern) | Plot | Plot | Plot |
| TREFHT | 2-meter air temperature (land) | Plot | Plot | Plot |
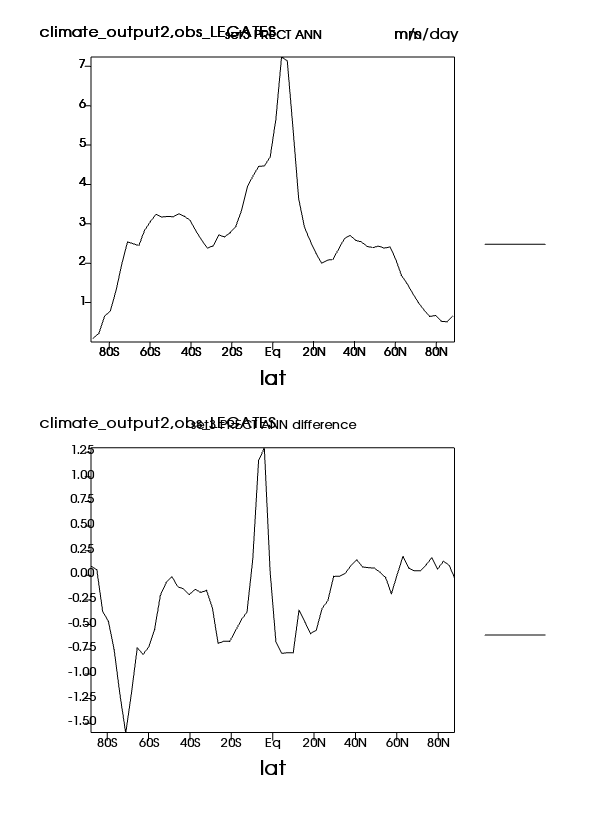
| PRECT | Precipitation rate | Plot | Plot | Plot |
| FSNTOA | TOA net SW flux (Northern) | Plot | Plot | Plot |
| LWCF | TOA longwave cloud forcing | Plot | Plot | Plot |
| FSNTOAC | TOA clearsky net SW flux (Northern) | Plot | Plot | Plot |
| SWCF | TOA shortwave cloud forcing | Plot | Plot | Plot |
| FLUTC | TOA clearsky upward LW flux (Northern) | Plot | Plot | Plot |
| FLUT | TOA upward LW flux (Northern) | Plot | Plot | Plot |
| TREFHT | 2-meter air temperature (land) | Plot | Plot | Plot |
| PREH2O | Total precipitable water | Plot | Plot | Plot |
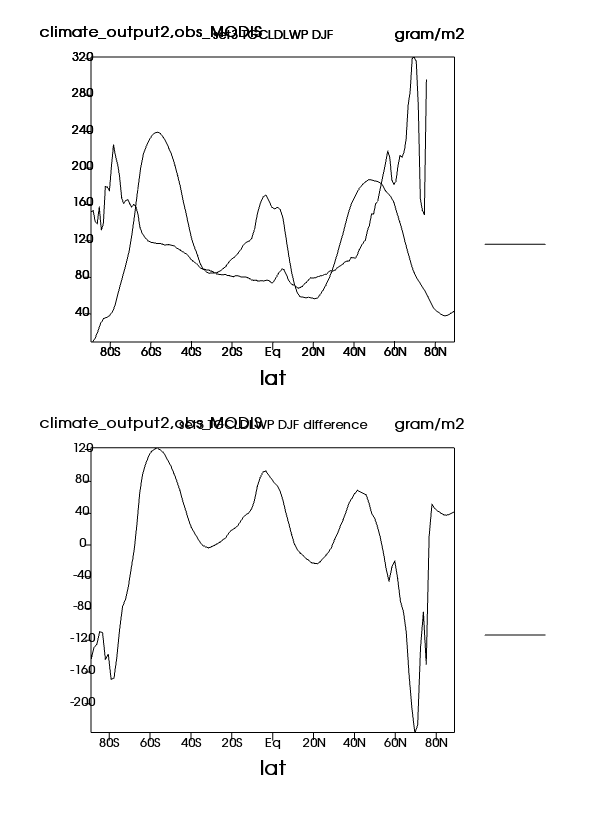
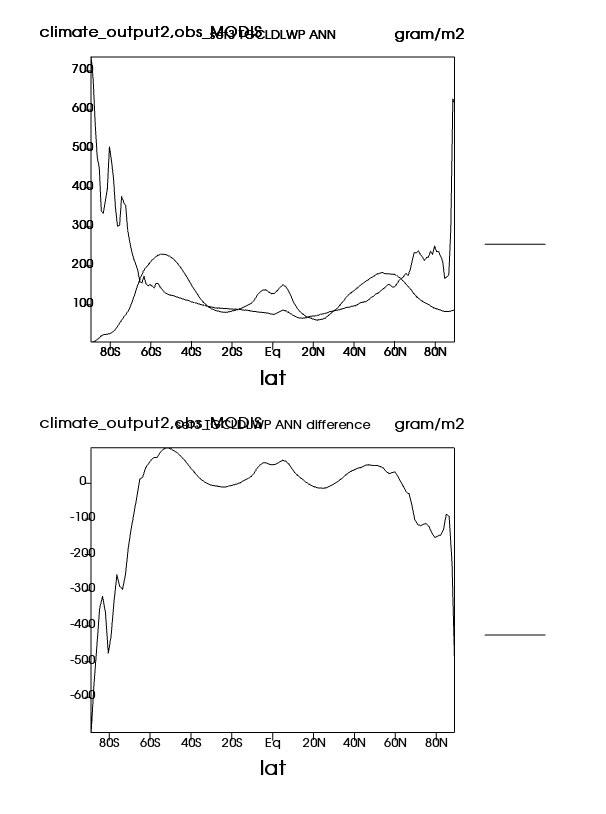
| TGCLDLWP | Cloud liquid water | Plot | Plot | Plot |
| PREH2O | Total precipitable water | Plot | Plot | Plot |
| FSNS | Surf Net SW flux (Northern) | Plot | Plot | Plot |
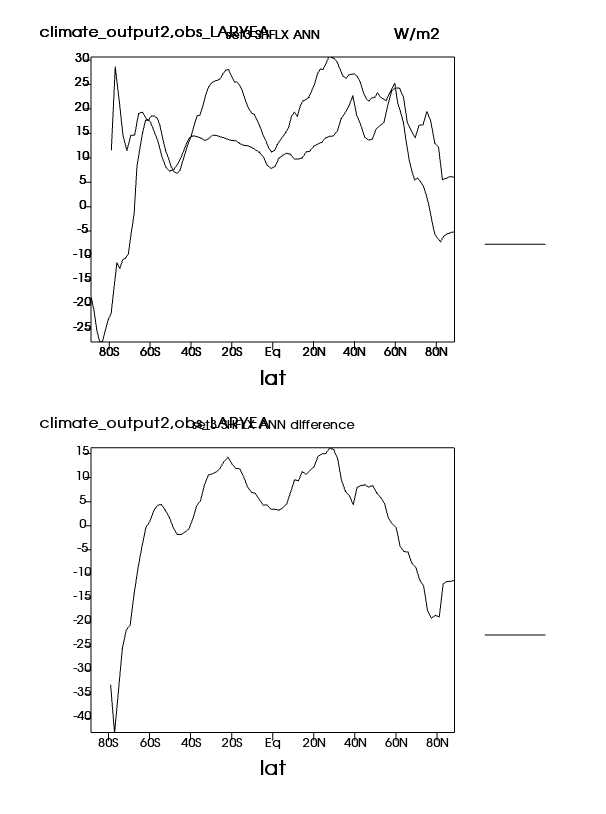
| SHFLX | Surface sensible heat flux | Plot | Plot | Plot |
| QFLX | Surface water flux (Northern) | Plot | Plot | Plot |
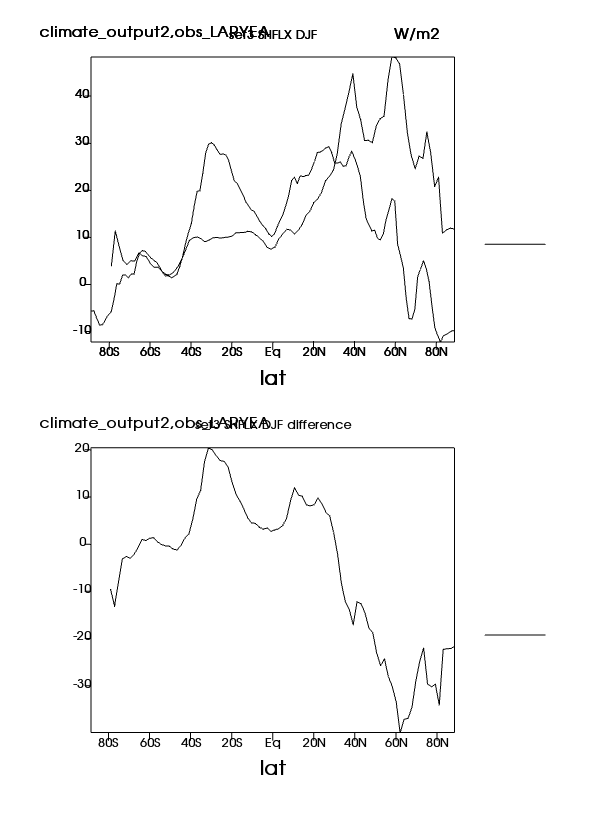
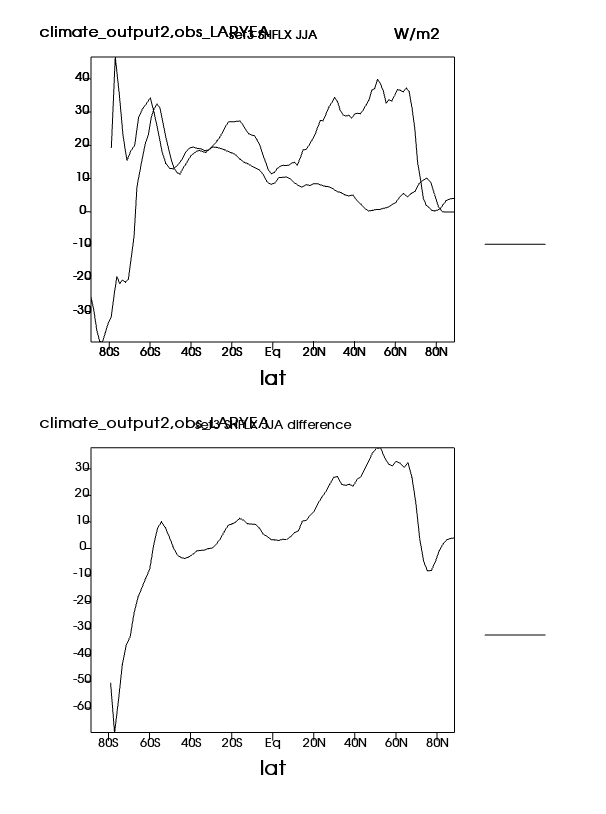
| FLNS | Surf Net LW flux (Northern) | Plot | Plot | Plot |
| TGCLDLWP | Cloud liquid water | Plot | Plot | Plot |
| PREH2O | Total precipitable water | Plot | Plot | Plot |
| FSNTOA | TOA net SW flux (Northern) | Plot | Plot | Plot |
| LWCF | TOA longwave cloud forcing | Plot | Plot | Plot |
| FSNTOAC | TOA clearsky net SW flux (Northern) | Plot | Plot | Plot |
| SWCF | TOA shortwave cloud forcing | Plot | Plot | Plot |
| FLUTC | TOA clearsky upward LW flux (Northern) | Plot | Plot | Plot |
| FLUT | TOA upward LW flux (Northern) | Plot | Plot | Plot |
| PRECT | Precipitation rate | Plot | Plot | Plot |
| PRECT | Precipitation rate | Plot | Plot | Plot |
| TGCLDLWP | Cloud liquid water | Plot | Plot | Plot |
| PRECT | Precipitation rate | Plot | Plot | Plot |
| PREH2O | Total precipitable water | Plot | Plot | Plot |
| LHFLX | Surface latent heat flux | Plot | Plot | Plot |
| QFLX | Surface water flux (Northern) | Plot | Plot | Plot |
| PREH2O | Total precipitable water | Plot | Plot | Plot |
 AMWG 05/03/16 08:32:02 and OBS Data
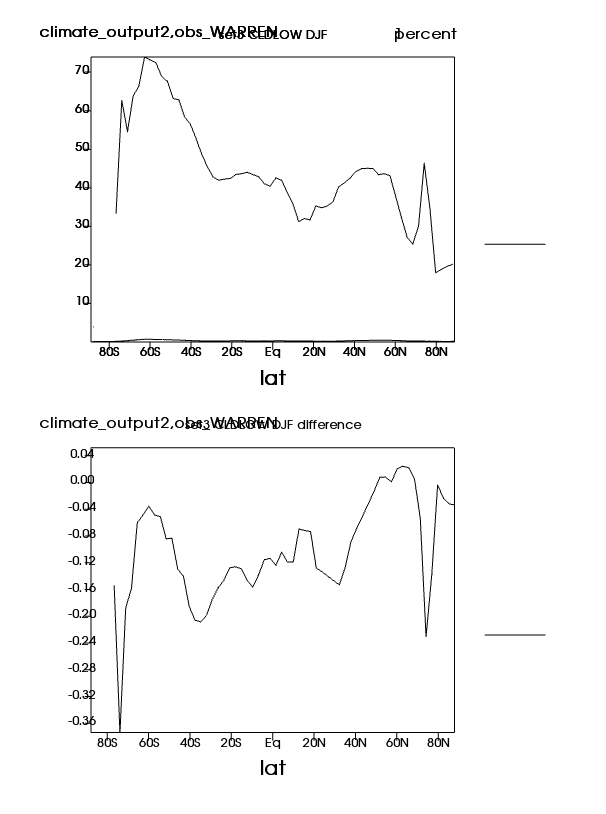