2.4 Release New Features
We’ve got 4 significant updates in the 2.4 release:
For a quick reference of all examples in this announcement, check out this page in the gallery.
Color Management
It’s been a bit difficult to manually specify colors in VCS; you have to memorize the index of colors you want out of the 255-color colormap, and have “magic” numbers sprinkled throughout your code wherever you reference a color. That system will remain in place (backwards compatibility is very important to us), but @doutriaux1 majorly reworked the color logic throughout VCS to make it substantially more user-friendly.
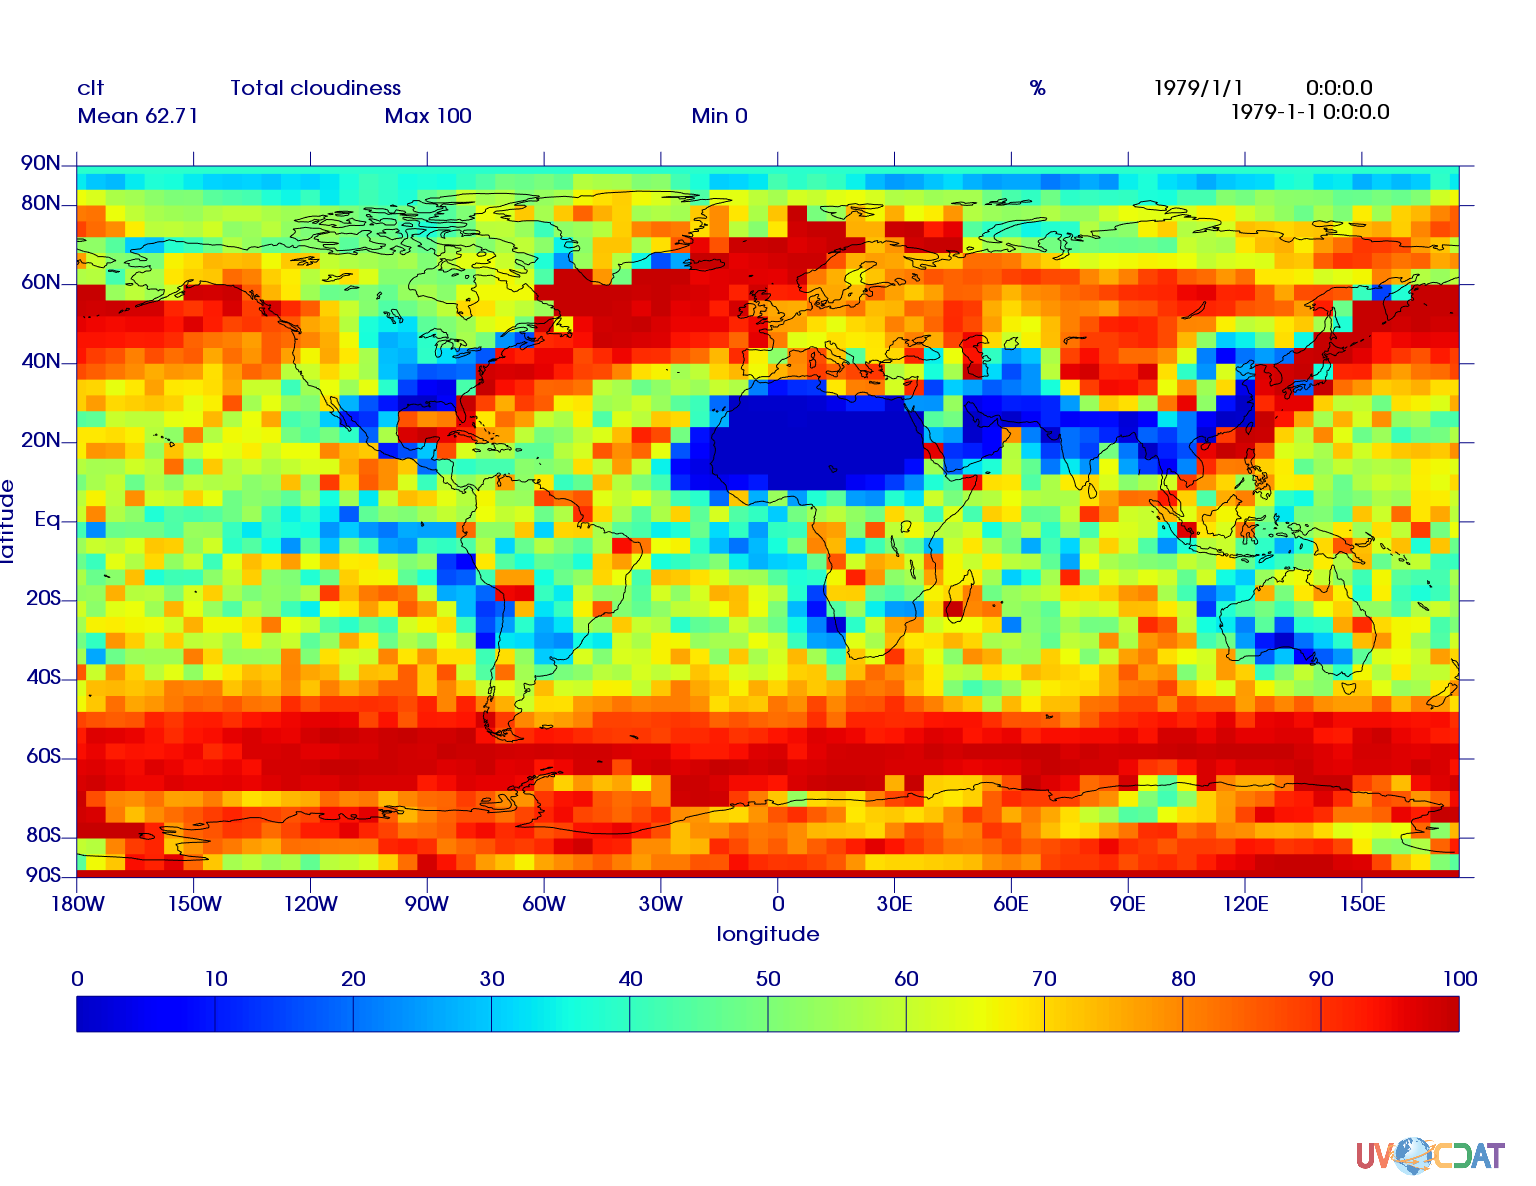
We now support X11 color names, RGBA, and RGB color assignment, which you can check out in the gallery.
Colormaps now use RGBA values as well!
Also, you can now use any matplotlib colormap!
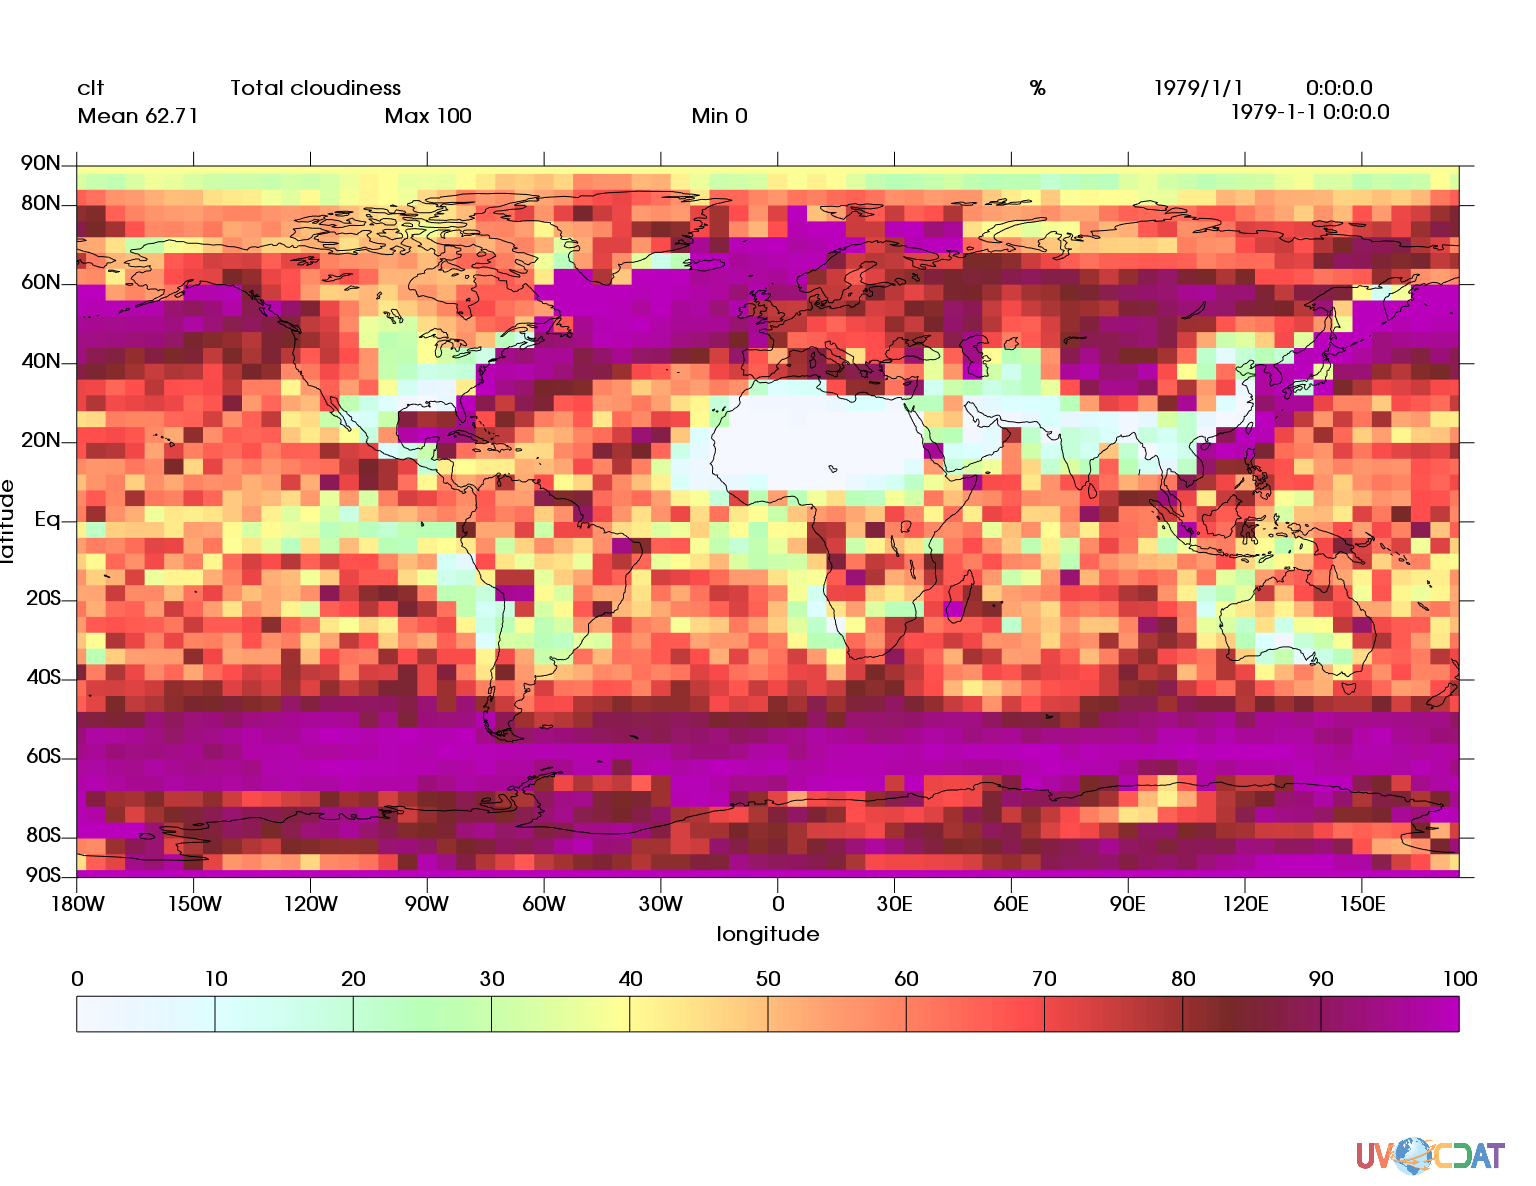
Patterns/Hatches
At long last, we’ve closed issue #541 (Thanks for being patient, @jypeter!). Patterns and hatches are available for boxfills, isofills, meshfills, and fillareas.
Pattern/Hatches Concepts
fillarea provides a simple way to introduce the concepts of patterns and hatches. The fillarea object is a secondary graphics method, for those who aren’t familiar with it. It allows you to provide a series of points, and will create a filled area styled to your specifications.
There are three attributes that are relevant to Patterns and Hatches for fillareas.
stylesolid- The default; renders a solid color.
pattern- A black pattern
hatch- A pattern with the color determined by the
colorattribute of the fillarea
- A pattern with the color determined by the
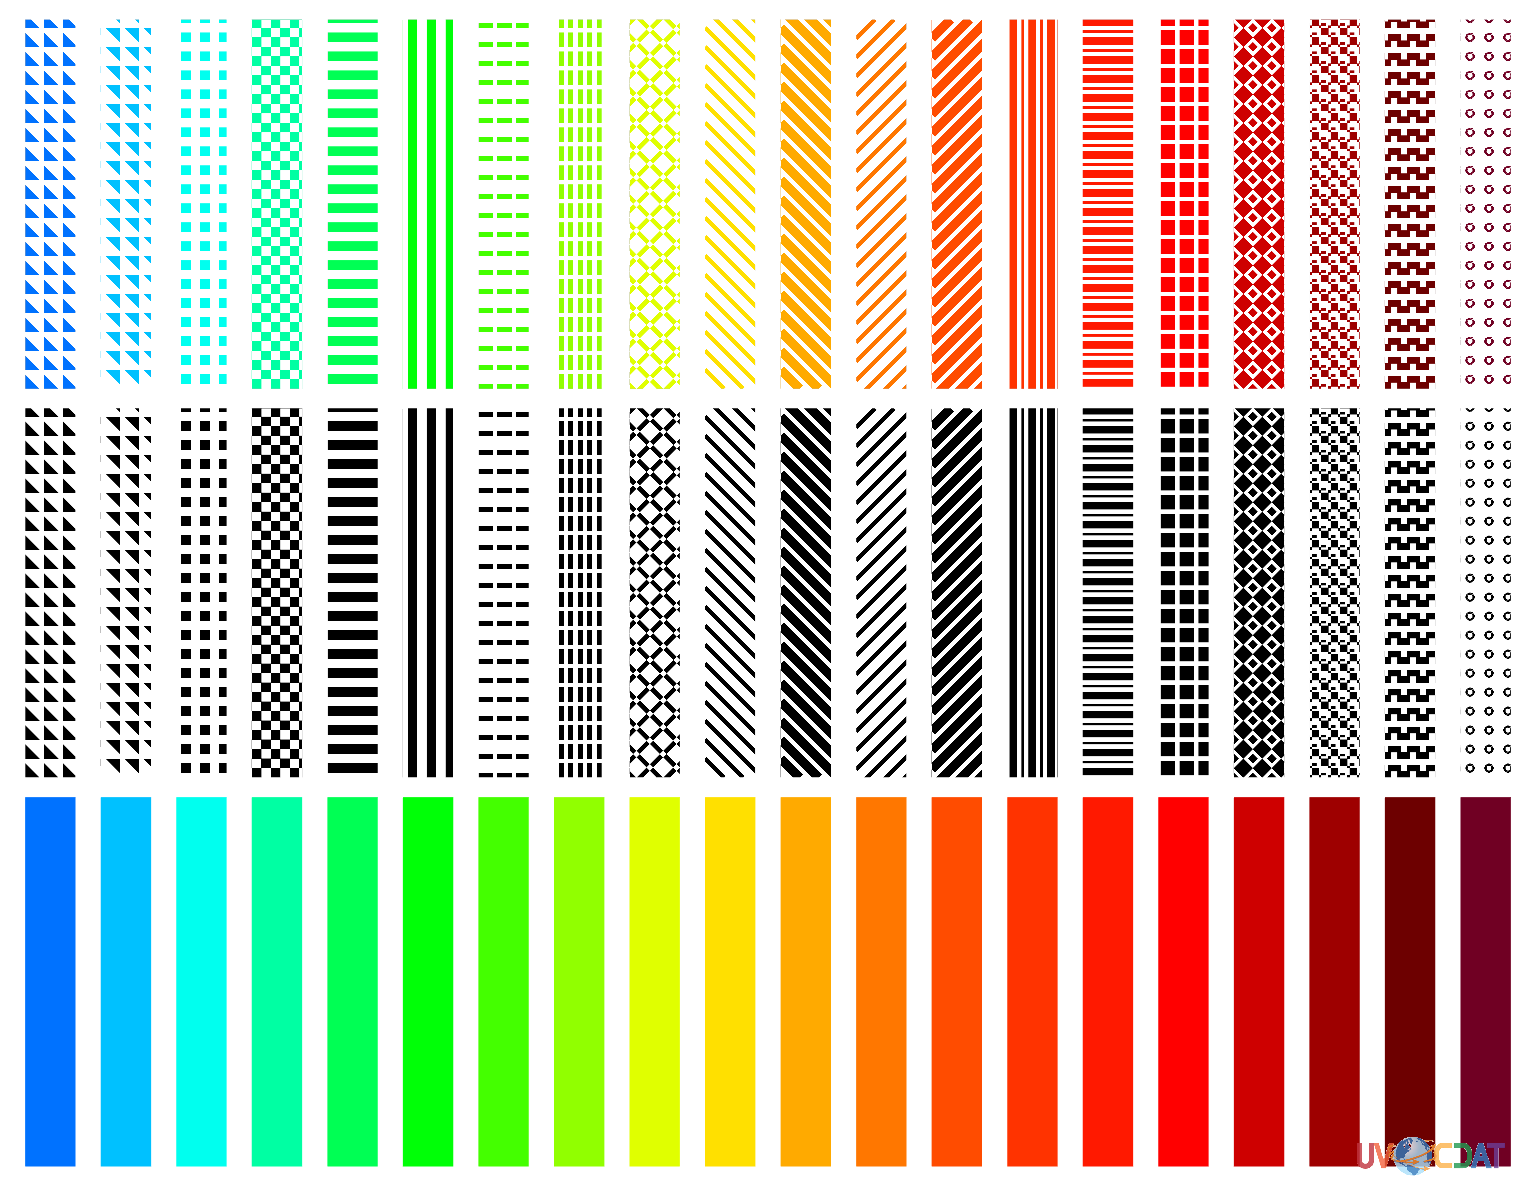
index- The pattern to use
- Accepts 1-20
- Refer to the chart above
opacity- Controls the transparency of the pattern/color
- A float between 0 and 100
For primary graphics methods (Boxfill, Isofill, Meshfill), you use these attributes:
fillareastyle- Matches with
styleabove. Acceptshatch(colored pattern),pattern(black pattern), orsolid(no pattern, the default)
- Matches with
fillareaindices- Matches with
indexin the examples above. Accepts a list of integers between 1 and 20; refer to the chart above to know what patterns to expect for what index. You provide one index per level in your plot.
- Matches with
fillareaopacity- Matches with
opacityin the examples above. Accepts a list of floats between 1 and 100. You provide one opacity value per level in your plot.
- Matches with
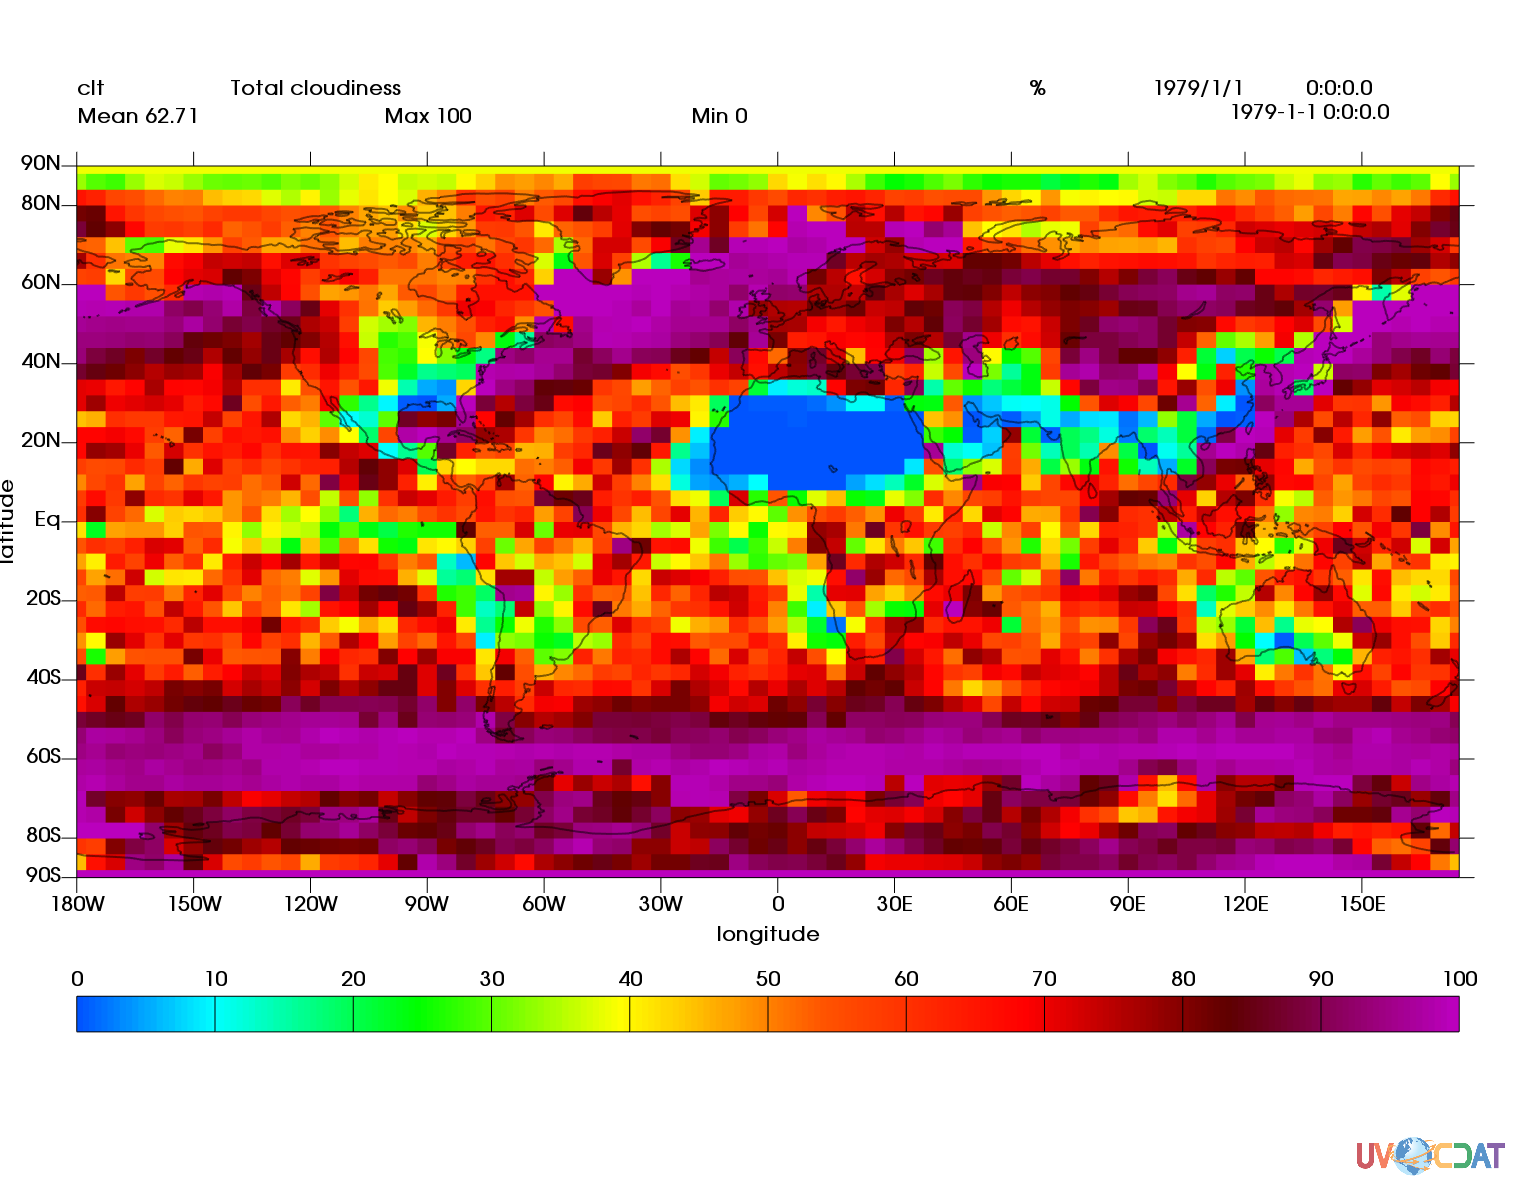
However, if you’re going to use these, you’re also going to have to specify levels for the graphics method. Normally, the graphics method will determine levels based off of the values at the current time slice; when you want to control the appearance of those levels, you need to specify them manually. For clt, we can just use a range from 0 to 100 at increments of 20.
Important Note:
levelsdescribes the bounds of ranges, whereasfillareaindicesandfillareacolorsboth describe the ranges themselves. You need one more level than indices or colors.
Examples
Canvas and Output Sizing
We’ve done some touch-up to the process of sizing your canvas in VCS.
Default Behavior
import vcs
canvas = vcs.init()
canvas.open()
This should create a window that is a reasonable size for your monitor.
Custom Sizing
If you want a specific size, you can pass in arguments to either vcs.init() or canvas.open(), like so:
import vcs

canvas1 = vcs.init(geometry={"width":1200, "height":800})
canvas1.open()

canvas2 = vcs.init(geometry=(1200, 800))
canvas2.open()

canvas3 = vcs.init()
canvas3.open(width=1200, height=800)
Widths and heights passed to canvas.open() will override the geometry passed in to vcs.init().
Sizing Output
If you call canvas.png with only a filename as an argument, you’ll get your output in the same dimensions as the canvas.
import vcs
canvas = vcs.init(geometry=(300, 200))
canvas.open()
canvas.png("test")
But if you want to size the output to a different size, you can pass in height and width keyword arguments to the canvas.png function.
import vcs
canvas = vcs.init(geometry=(600, 400))
canvas.open()
canvas.png("test", width=800, height=500)
Important Note:
vcswill attempt to keep image dimensions as portrait or landscape, depending on the current size of your canvas. This means that if you callcanvas.png("file", width=600, height=300)but your canvas’ dimensions are500x800, your output will be300x600.
Continents Styling
You can now specify the appearance of continents using the vcs line primitive and the continents_line keyword of the canvas.plot function. A simple example can be found here