Masking Data Land-Sea Masks (Advanced) 
In this example we will show more ways to generate masks, including land/sea masks.
The CDAT software was developed by LLNL. This tutorial was written by Charles Doutriaux. This work was performed under the auspices of the U.S. Department of Energy by Lawrence Livermore National Laboratory under Contract DE-AC52-07NA27344.
Preparing the Notebook
In [3]:
import requests
r = requests.get("https://cdat.llnl.gov/cdat/sample_data/clt.nc",stream=True)
with open("clt.nc","wb") as f:
    for chunk in r.iter_content(chunk_size=1024):
        if chunk:  # filter local_filename keep-alive new chunks
            f.write(chunk)

# and load data
import cdms2
f = cdms2.open("clt.nc")
clt = f("clt", time=slice(0,1), squeeze=1) # Get first month
u = f("u", level=slice(0,1), squeeze=1)
v = f("v", level=slice(0,1), squeeze=1)
clt = clt.regrid(u.getGrid(), regridTool="regrid2") # Put data on same grid

# computes wind speed
import MV2
speed = MV2.sqrt(u**2+v**2)
print("Max speed:", speed.max())
print("Mean speed:",speed.mean())
print("Min speed:",speed.min())

# Prepare graphics
import vcs
x=vcs.init()
Value based masks
In [2]:
# Let's mask out area where wind speed is greater than twice mean
mask = MV2.greater(speed,speed.mean()*2.)

# Let's apply this mask
clt_masked = MV2.masked_where(mask,clt)
x.plot(clt_masked)

Out[2]:
Land-sea Masks
Generating a Land-sea Mask on any grid
Conveniently CDAT can generate masks for you (for regular grids only).
The observed data set used here as the basis for creating realistic model land/sea masks was obtained from the U.S. Navy on a 1/6 degree longitude-latitude grid.
More on the technique used can be read here
In [ ]:
import cdutil
mask = cdutil.generateLandSeaMask(clt)
mask2 = MV2.where(mask._mask,1.,mask) # Not needed for cdutil versions >= 2.12.2017.9.25
mask2.setAxisList(mask.getAxisList()) # Not needed for cdutil versions >= 2.12.2017.9.25
clt_masked = MV2.masked_where(mask2,clt)
x.clear()
x.plot(clt_masked)
In [ ]:
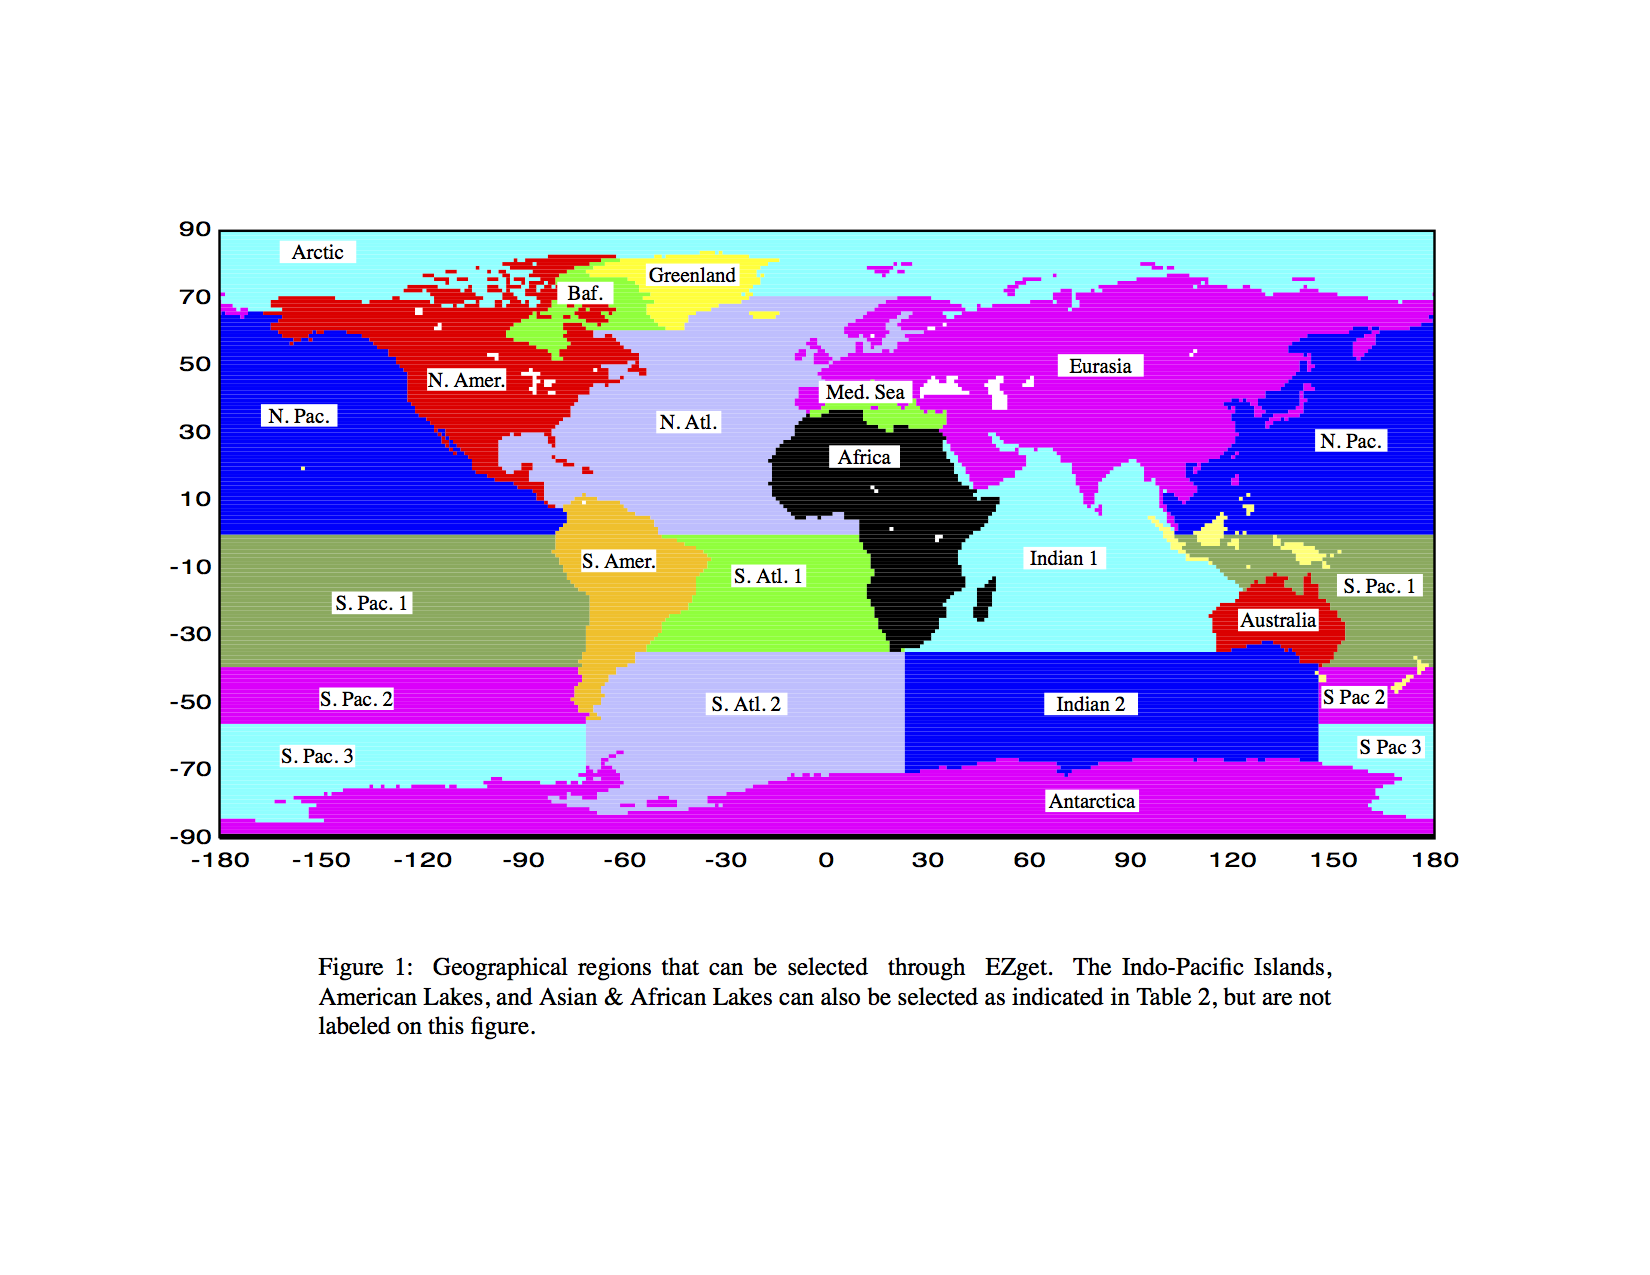
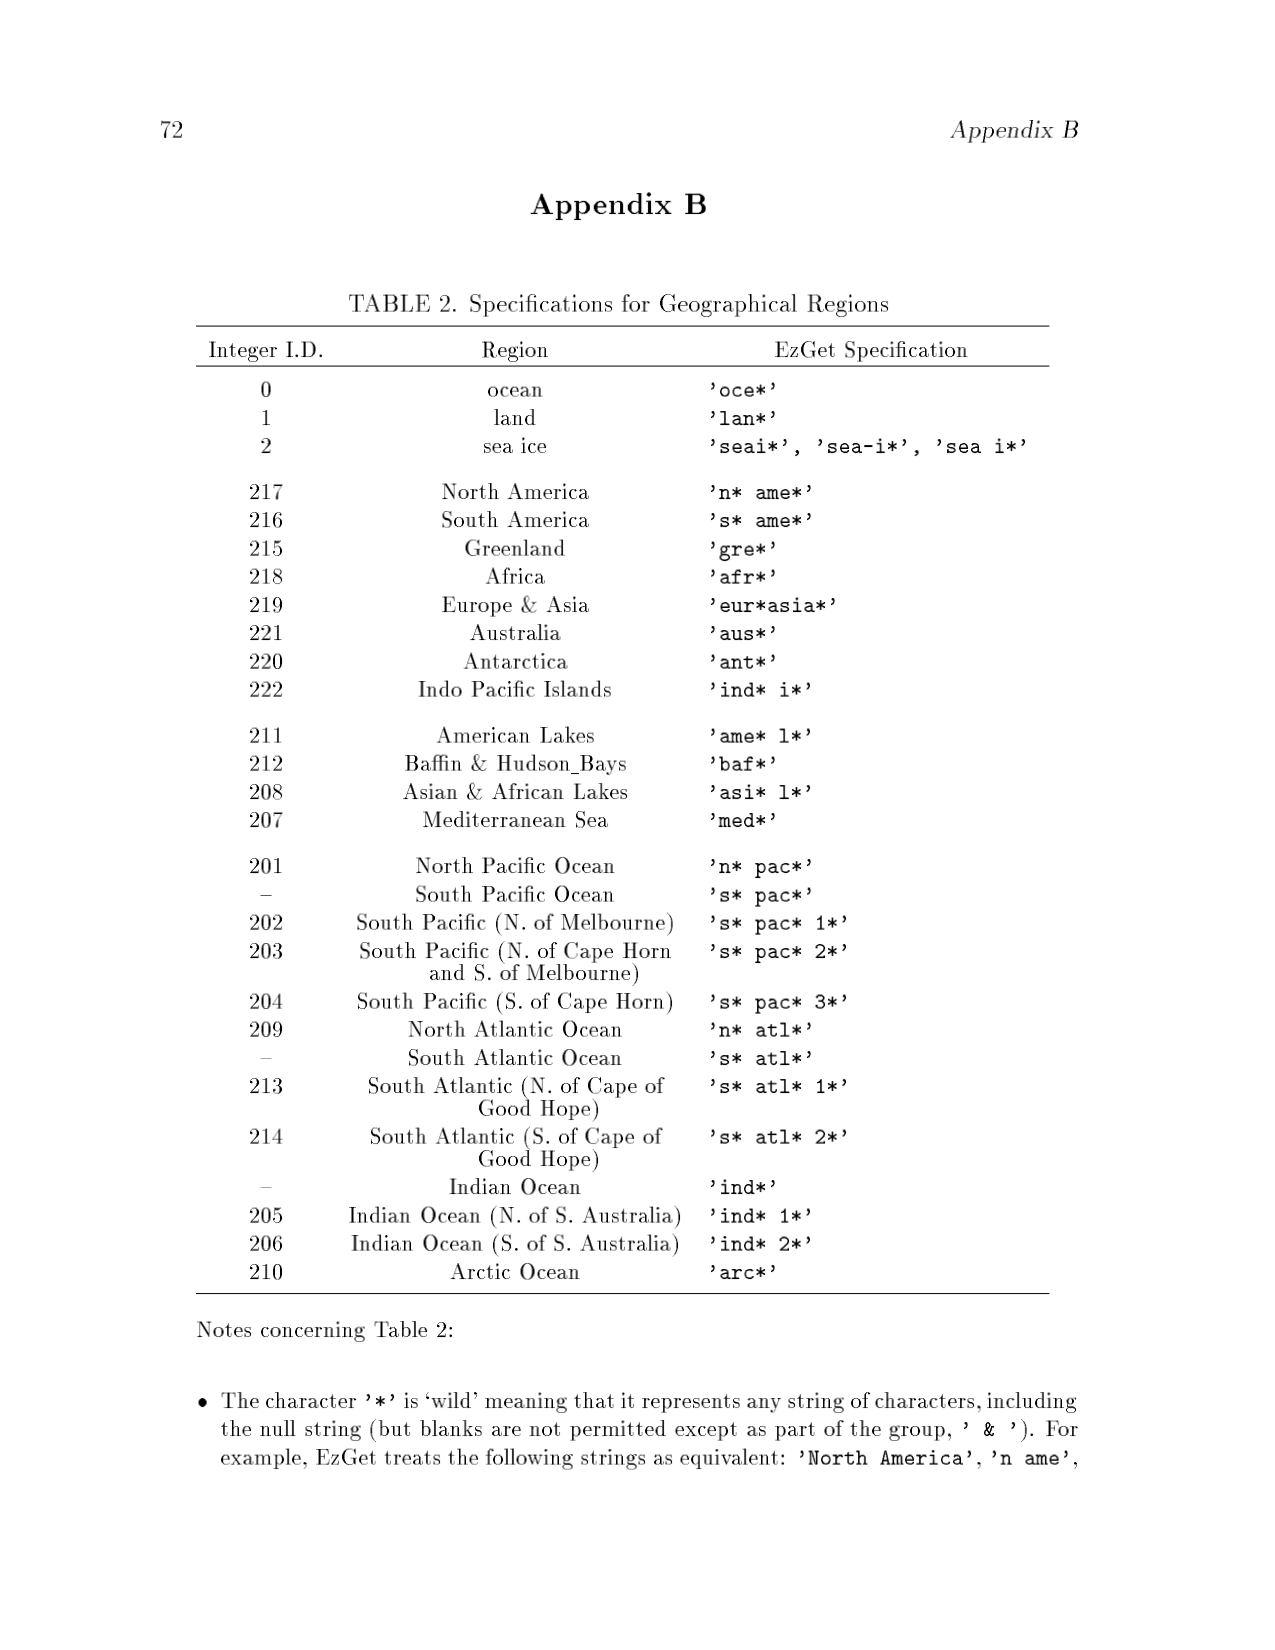
regions, guess = cdutil.generateSurfaceTypeByRegionMask(mask2*100., verbose=False)
In [ ]:
# let's take a look
x.clear()
x.plot(regions)
In [ ]:
# Now let's extract the indian ocean which according to table are area 205 and 206
ind1 = MV2.equal(regions,205)
ind2 = MV2.equal(regions,206)
indian_ocean = MV2.logical_or(ind1,ind2)

clt_indian_ocean = MV2.masked_where(MV2.logical_not(indian_ocean),clt)
x.clear()
x.plot(clt_indian_ocean(longitude=(15,150),latitude=(-90,35)),ratio="autot")